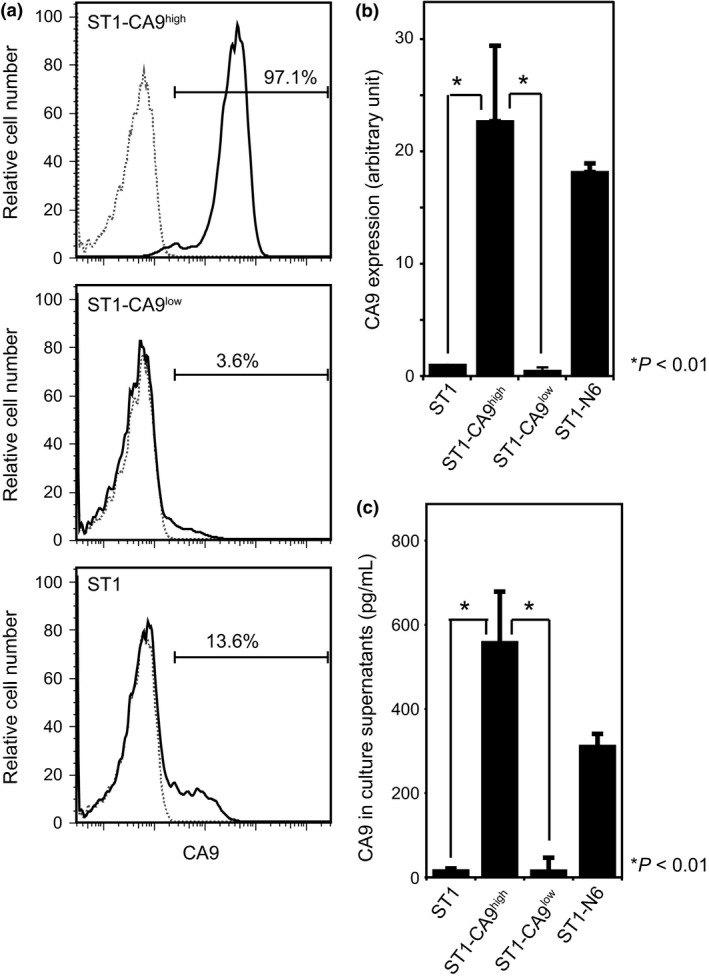
Figure 2.

CA9 expression in ST1 and subline cells. (a) Flow cytometry analysis showing the percentage of CA9‐positive cells in ST1 cells and ST1‐CA9high and ST1‐CA9low sublines. Cells were stained with anti‐CA9 (solid lines) or isotype‐matched control (dotted lines) antibodies. (b) RT‐PCR analysis of CA9 expression in ST1 cells and sublines. (c) Concentration of soluble CA9 in culture supernatants of ST1 cells and sublines, measured by ELISA.
