Figure 5.

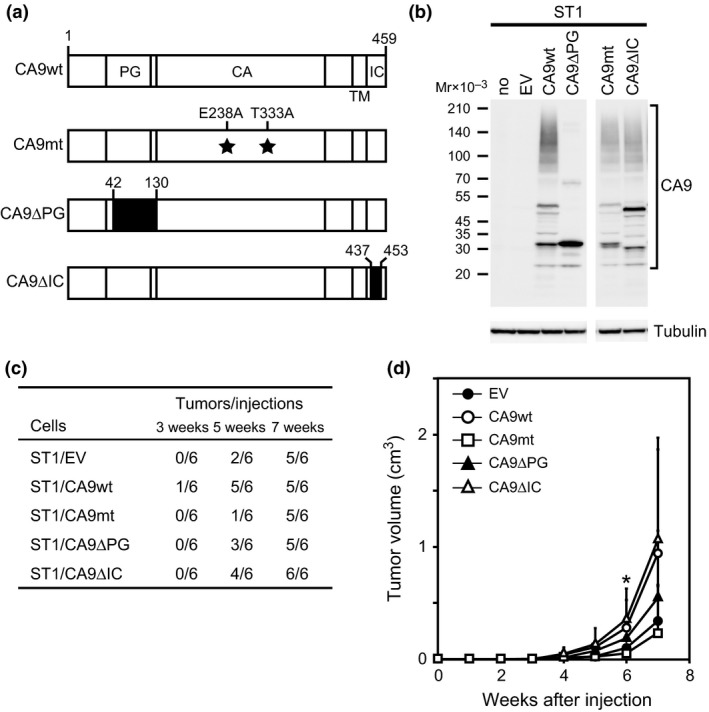
Effects of CA9 mutations on ST1‐cell tumorigenicity. (a) Schematic representation of CA9 and its mutants. Amino acid numbers are shown above each construct. Deleted regions are shown by filled boxes. PG, proteoglycan‐like domain; CA, catalytic domain; TM, transmembrane domain; IC, intracytoplasmic domain. (b) ST1 cells were transfected with vectors expressing CA9wt, CA9mt, CA9∆PG, and CA9∆IC, or an empty control vector (EV). CA9wt, CA9∆CA, CA9∆PG, and CA9∆IC expression levels in transfected cells were verified by Western blot. (c) Transfected cells were injected into six dorsal sites (1 × 10⁴ cells/site) in NOG mice and the number of palpable tumors that developed was monitored. (d) Tumor growth was observed weekly. Data are the mean with the SD of the tumor sizes at the six injection sites. *P < 0.05 for CA9wt versus CA9mt.
