
Figure 2.
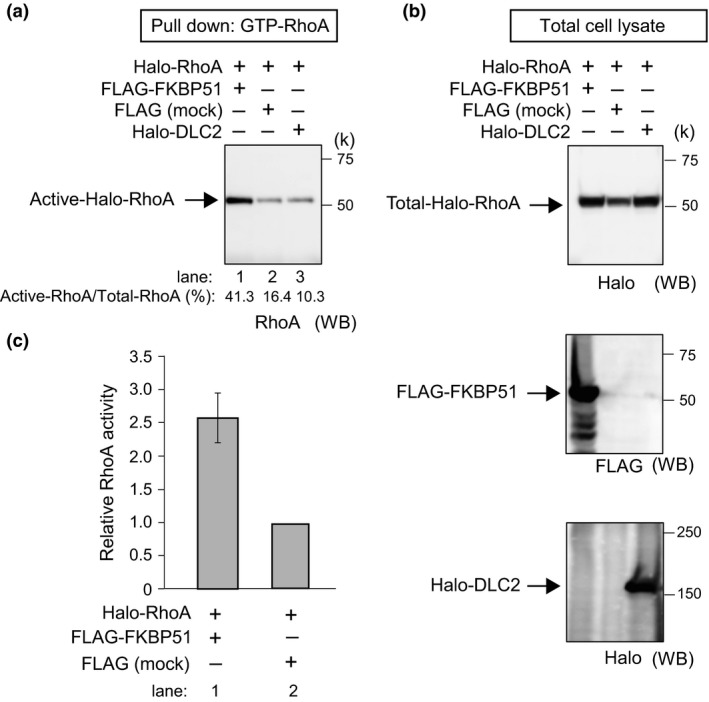
FKBP51 overexpression increases RhoA activation. (a) 293T cells were transfected with the indicated expression vectors for 24 h and then subjected to the RhoA activation assay. Western blotting was completed after the pull‐down of activated forms of RhoA in cells expressing FKBP51 or DLC2. (b) Cells expressing FLAG‐FKBP51 or Halo‐DLC2 were visualized by anti‐Halo and anti‐FLAG antibodies. (c) Corresponding quantification from independent pull‐down experiments (normalization of the GTP‐bound forms to total RhoA) (left figure and column graph). Data in the column graph are represented as the mean ± SEM (n = 3; FLAG‐FKBP51 and FLAG‐mock for the RhoA pull‐down assay).