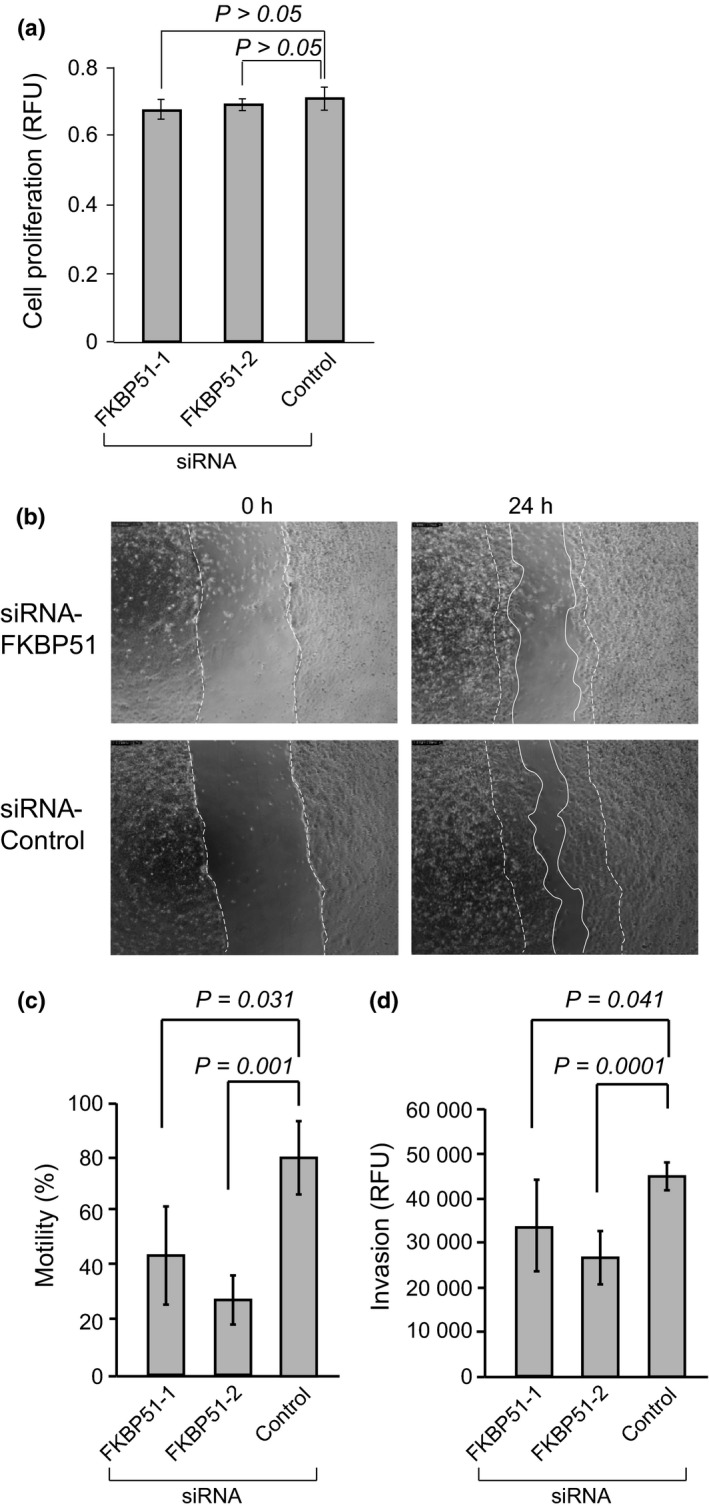
Figure 5.

Cell motility and invasion assay following knockdown of FKBP51. (a) U2OS cells were treated with siRNA‐FKBP51 or siRNA‐control for 48 h. Next, proliferation was measured using the WST‐1 assay. Relative fluorescence units (RFU) indicate the relative amount of proliferation. Column graphs show the mean ± SEM from five samples. (b) U2OS cells were treated with siRNA‐FKBP51 or siRNA‐control for 48 h and then subjected to the wound‐healing assay. Phase contrast images are shown for 0 and 24 h. The dotted lines indicate cells at the start of the experiment, and white lines show the tips of migrated cells after 24 h. (c) Column graphs show the mean ± SEM from three samples. (d) U2OS cells were treated with siRNA‐FKBP51 or siRNA‐control for 48 h and then subjected to the cell invasion assay. Relative fluorescence units (RFU) indicate the relative amount of proliferation. Column graphs show the mean ± SEM from three samples.
