Figure 3.

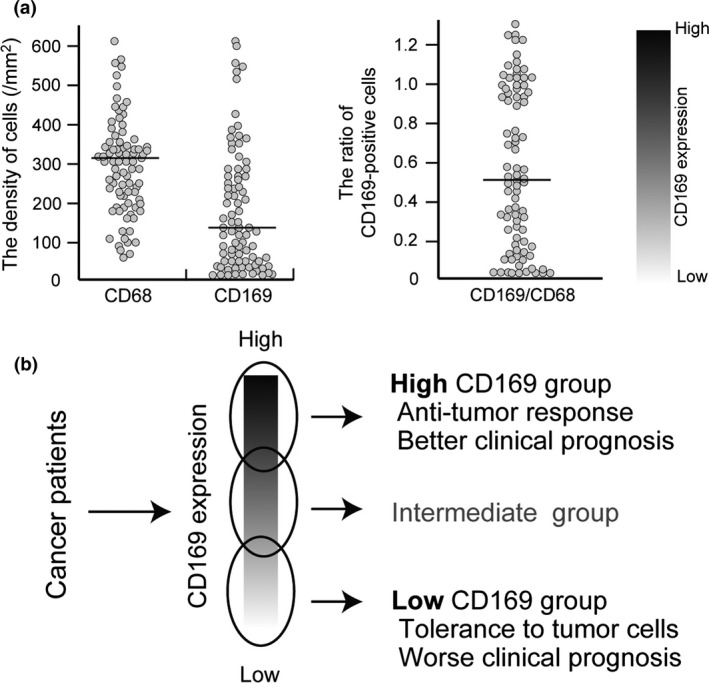
Summary of the data of the study of colorectal cancer. (a) Scatter diagrams of the number of CD68‐ and CD169‐positive macrophages (left) and the ratio of CD169+:CD68+ macrophages (right) in the LN sinus. The value of the CD169+:CD68+ macrophage ratio in the LN sinus indicated the variation of CD169 expression in individuals. (b) Cases with high CD169 expression in LN sinus macrophages showed high infiltration of CD8‐positive CTLs and better clinical course, and vice versa. These phenomena were observed when the cases were divided into high or low CD169 expression groups based on median cell numbers or based on the CD169+:CD68+ ratio. However, cases with intermediate CD169 expression are also seen and it might be difficult to strictly classify these cases into either a high or low CD169 expression group.
