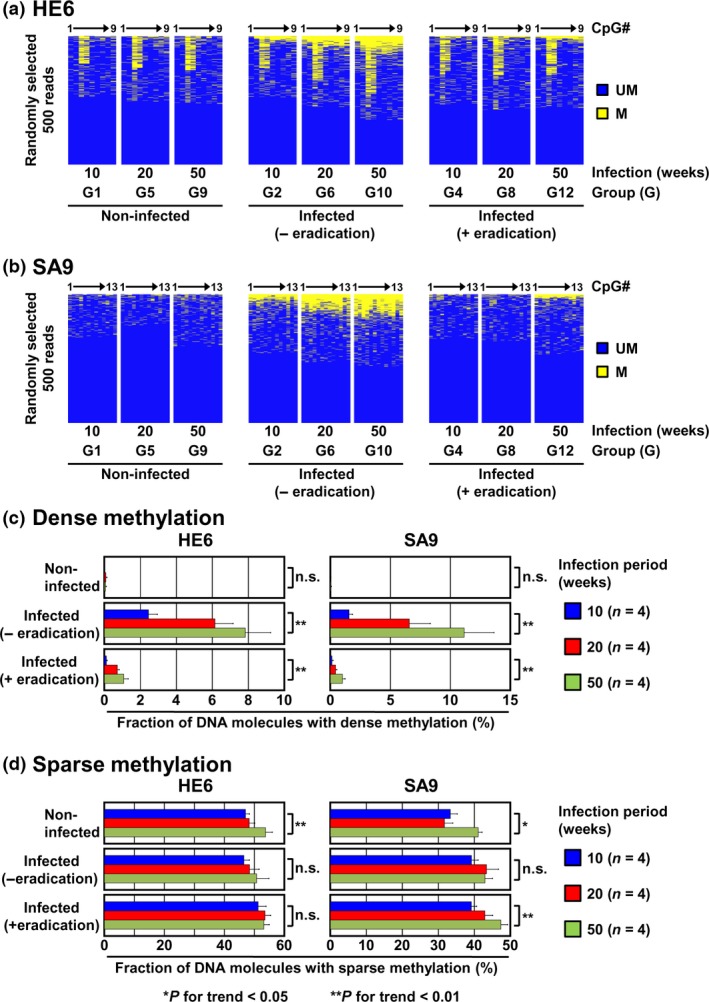
Figure 4.

Accumulation of dense DNA methylation after eradication depending upon the Helicobacter pylori infection period. (a) and (b) DNA methylation status of HE6 and SA9. DNA methylation status was analyzed by bisulfite sequencing using a next‐generation sequencer. Number of methylated CpG sites after eradication increased depending upon the infection period. DNA methylation statuses of 500 DNA molecules randomly selected are shown. Yellow, methylated CpG sites; blue, unmethylated CpG sites. (c) and (d) Fraction of DNA molecules with dense (c) and sparse (d) DNA methylation. Fraction of dense methylation increased depending upon the infection period. Mean fraction ± standard error (SE) is shown.
