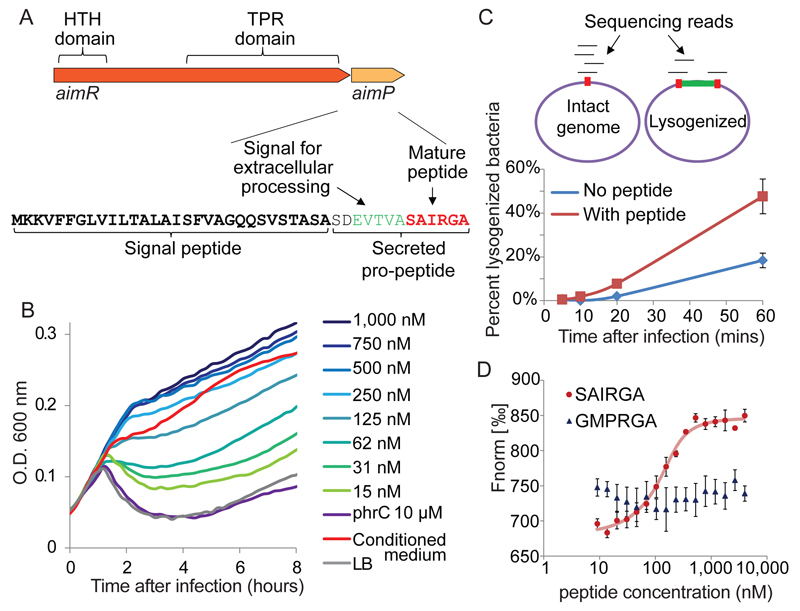
Figure 2. The arbitrium peptide and its receptor.
(A) The arbitrium locus in the phage genome. (B) Growth curves of B. subtilis 168 infected by phi3T at MOI=0.1, in LB media supplemented with synthesized SAIRGA peptide. Numbers represent peptide concentrations. Average of 3 biological replicates, each with 3 technical replicates. (C) Sequencing-based quantitative determination of the fraction of lysogenized bacteria. Top – schematics of the analysis. Percent lysogeny was calculated as the fraction of reads spanning the phage/bacteria integration junction out of total reads covering this junction. Integration junction is red; integrated phage is green. Bottom: percent lysogenized bacteria during infection of B. subtilis 168 with phi3T at MOI=2. Average of three biological replicates, error bars denote SE. Synthesized SAIRGA peptide was added at 1 µM. (D) Microscale thermophoresis (MST) analysis of the binding between purified AimR and synthesized SAIRGA or GMPRGA peptides. Average and SE of three replicates.

