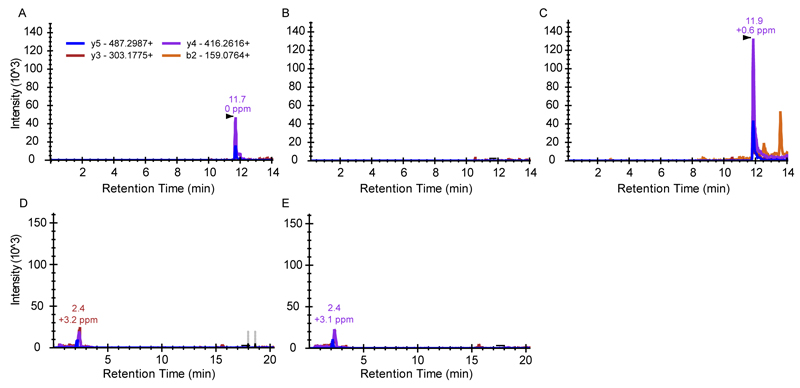
Extended data figure 3. Mass spectrometry verifies the presence of the SAIRGA peptide in conditioned medium.
Presented are extracted ion chromatograms of targeted MS analysis experiment. B2, Y3, Y4 and Y5 refer to fragmentation products of the peptides made by the instrument in the MS/MS process, with the expected m/z ion masses indicated. Y-axis represents the ion intensity of each fragment ion (arbitrary units). (A) Reference synthesized SAIRGA peptide at 100 nM concentration in LB. (B) Control medium from B. subtilis 168. (C) Conditioned medium from phi3T-infected B. subtilis 168. Arrowhead depicts the expected retention time of the SAIRGA peptide. (D) Control medium from B. subtilis 168 expressing dCas9 with a spacer targeting aimP. (F) Conditioned medium derived from phi3T-infected B. subtilis 168 expressing dCas9 with a spacer targeting aimP.

