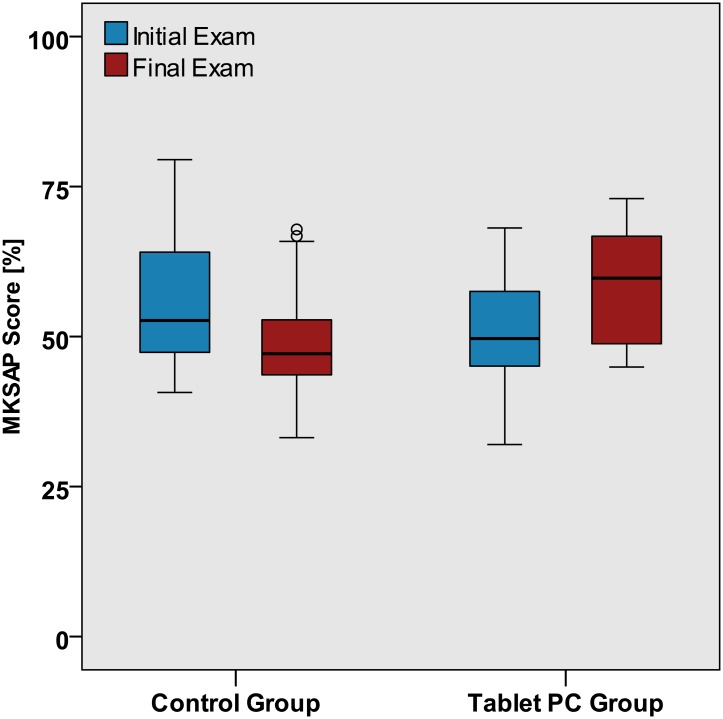
Fig 2. Statistically significant improvement of MKSAP® scores in the tablet but not the control group.
Control group (n = 31) mean MKSAP® score Δ — 7 (SD: 11). Tablet group (n = 24) mean MKSAP® score Δ + 8 (SD: 11). The overall result is also reflected in the MKSAP® median initial and final score change distribution by grouped by medical subject categories. Fig 3.

