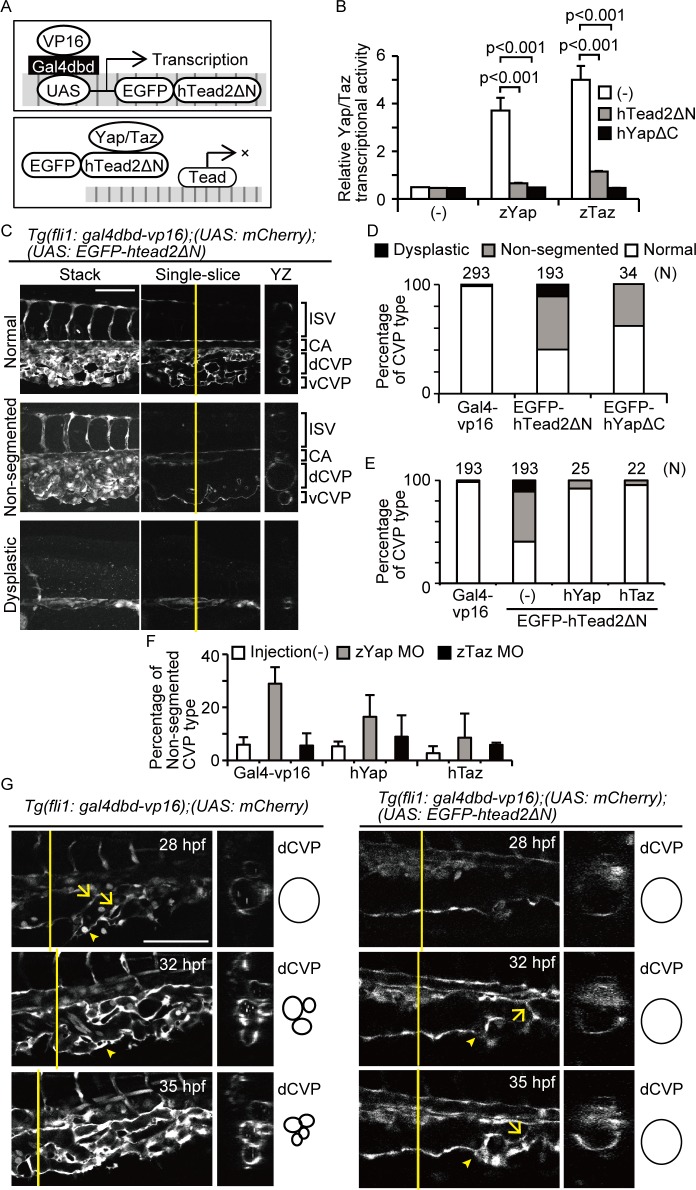
Fig 1. Yap/Taz transcriptional activity is essential for dCVP regression.
(A) Schemas represent the model of dominant-negative expression. (B) HEK293T cells were transfected with pFR-Luc and pcDNA3.1-Gal4-hTead2ΔN. Cells were also introduced with p3xflag-cmv-14-zYap, -zTaz, pEGFP-hTead2ΔN, and -hYapΔC as indicated. Cells were harvested 24 hours after transfection and measured the luciferase activity. Data are means and SDs (n = 3). (C and D) Images of Tg(fli1: gal4dbd-vp16);(UAS: mCherry);(UAS: EGFP-htead2ΔN) at 35 hours post-fertilization (hpf) are shown. Cross-sectional images of the plane indicated by the yellow lines (right) also shown. White color represents mCherry signals. Scale bars: 100 μm. CA, caudal artery; dCVP, dorsal part of the CVP; vCVP, ventral part of the CVP; ISV, intersegmental vessel. The results including Tg(fli1: gal4dbd-vp16);(UAS: EGFP-hyapΔC) were quantitated and shown as (D). The result of Tg(fli1: gal4dbd-vp16);(UAS: mCherry) is shown as Gal4-vp16. (E) Tg(fli1: gal4dbd-vp16);(UAS: EGFP-hTead2ΔN) fish were crossed with Tg(UAS: EGFP-hyap) or (UAS: EGFP-htaz) and analyzed as in (D). (F) Embryos were injected with morpholino for zYap or zTaz. The percentage of fish with non-segmented CVPs at 31 hpf is shown. The numbers of embryos analyzed is at the top of each bar. The result of Tg(fli1: gal4dbd-vp16);(UAS: mCherry) is shown as Gal4-vp16. (G) Single-slice and cross-sectional images of indicated embryos are shown. Arrows indicate endothelial cells sprouting into the lumen. Arrowheads indicate vCVP formation. White color shows mCherry signals. Scale bars: 100 μm.

