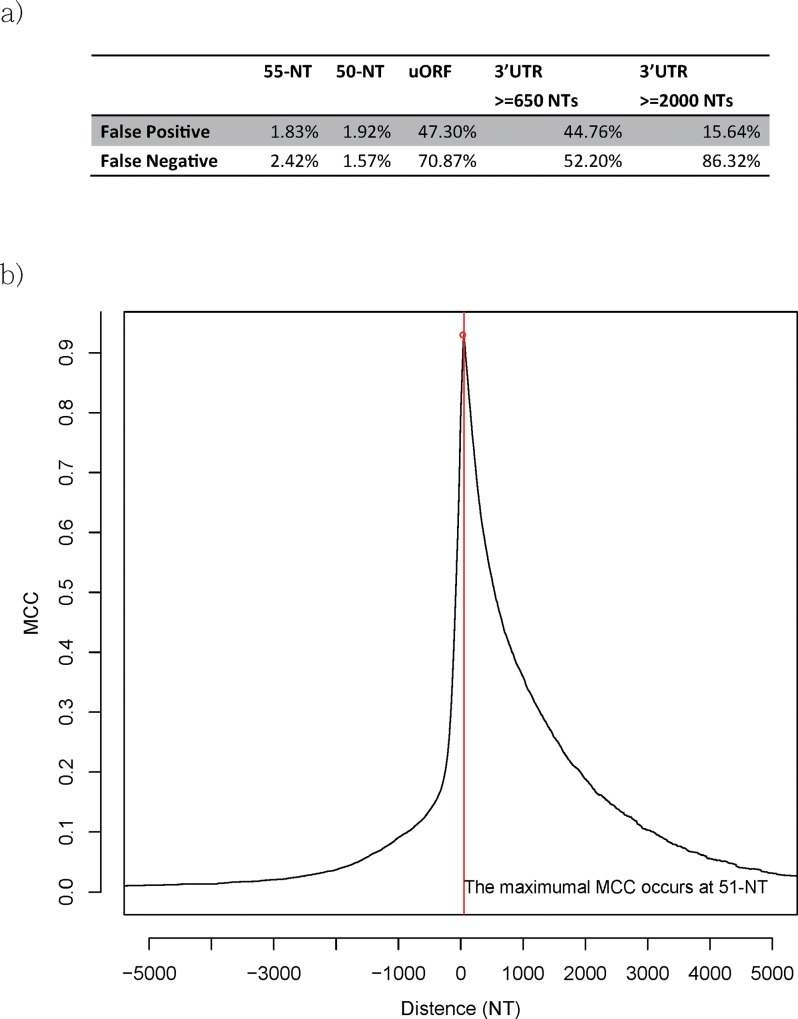
Fig 2.
(a) The distribution of MCC values across different distances between a PTC and the last exon-exon junction. A positive (negative) distance indicates that the PTC is located upstream (downstream) of the last exon-exon junction; (b) False positive and false negative rates of different NMD prediction rule.

