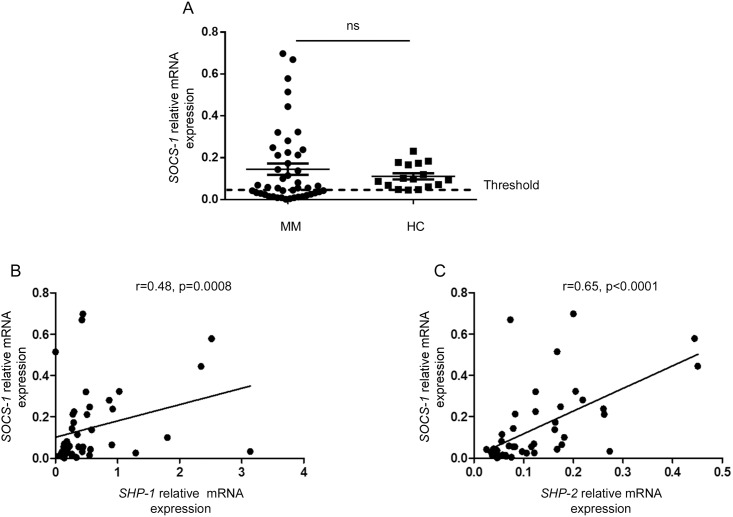
Fig 2. SOCS-1 gene expression in bone marrow plasma cells isolated from MM patients and healthy donors.
(A) Statistical dot plots showing the mRNA levels of SOCS-1 relative to the endogenous gene RPLP0 in sorted bone marrow plasma cells of healthy controls (HC, n = 16) and MM patients (MM, n = 45). (B, C) Correlation between SOCS-1 and SHP-1, SOCS-1 and SHP-2 relative gene expression in MM bone marrow plasma cells. Spearman rank correlation (r) and p values are indicated.

