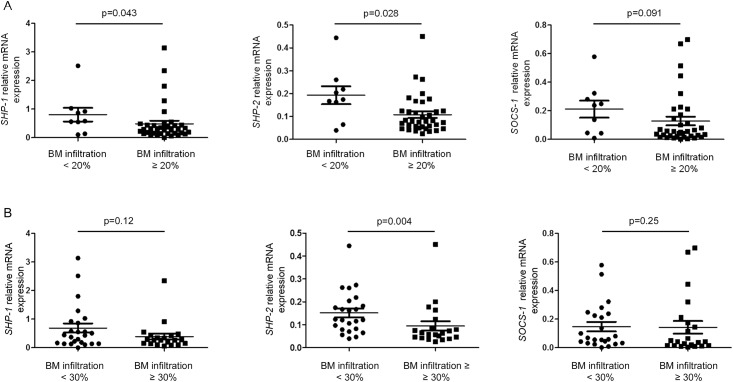
Fig 4. Gene expression of SHP-1, SHP-2 and SOCS-1 according to the degree of bone marrow infiltration.
(A, B) The relative gene expression of SHP-1, SHP-2 and SOCS-1 was compared in patients subdivided according to two different thresholds (20% and 30%) of bone marrow infiltration. P values are indicated.

