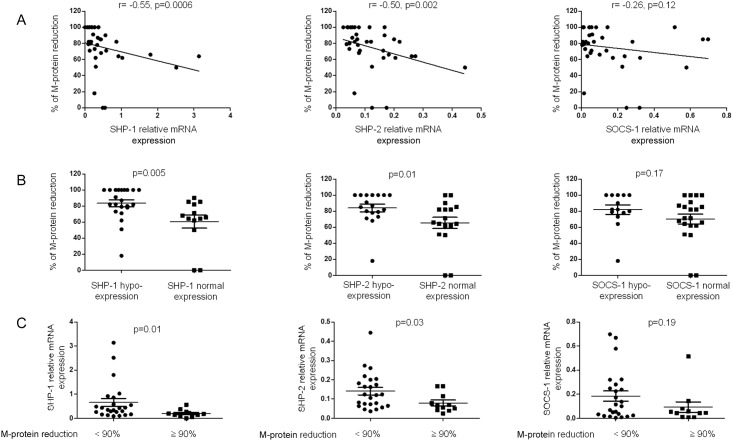
Fig 5. Gene expression of SHP-1, SHP-2 and SOCS-1 according to the percent reduction of the monoclonal component.
(A) Correlation between the reduction of the serum monoclonal component (M-component) and the relative expression of SHP-1, SHP-2 and SOCS-1 in sorted bone marrow plasma cells. Spearman rank correlation (r) and p values are indicated. (B) Levels of reduction in the serum M-component are compared between patients exhibiting normal or reduced expression of SHP-1, SHP-2 and SOCS-1. P values are indicated. (C) The relative gene expression of SHP-1, SHP-2 and SOCS-1 was compared between the two patient subgroups with a decrease in the M-component <90% or ≥90%. P values are indicated.

