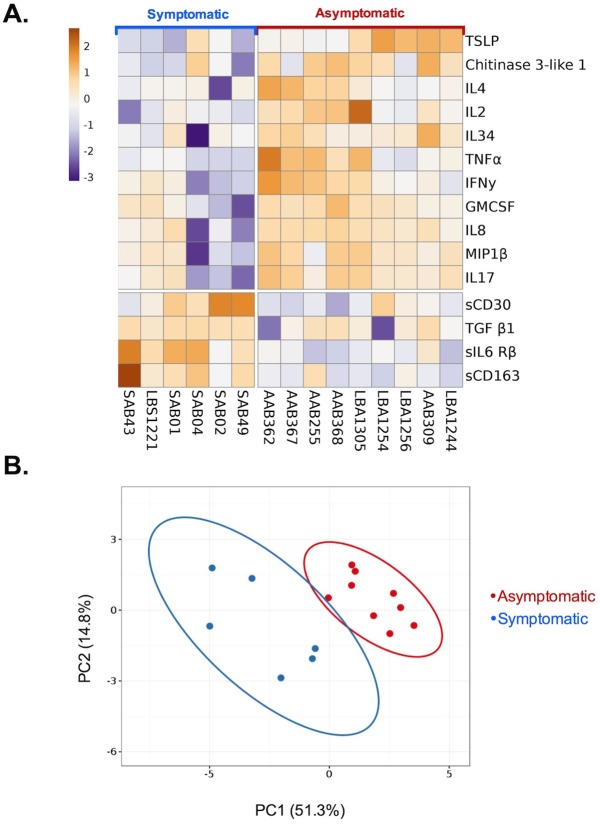
Fig 7. Heat map and principal component analysis of reciprocally expressed cytokines.
(A) A heat map was generating using log2-transformed concentration values of 15 differentially expressed cytokines identified using multiplex analysis to visualize differences between symptomatic and asymptomatic malaria patient groups. Values were centered by subtracting the mean cytokine concentration from all samples from each individual data point. (B) Scatter plot of the first two principal components (comprising 66.1% of total variance) calculated using singular value decomposition (SVD) with imputation. Symptomatic patient values (blue closed circles) and asymptomatic patient values (red closed circles) cluster separately. Colored ellipses denote calculated 95% confidence levels of new observations from other patients from this population structure (symptomatic vs. asymptomatic) falling within the respective regions. There is minimal overlap between the confidence levels between patient populations. Both the heat map and PCA were constructed using ClustVis [39].

