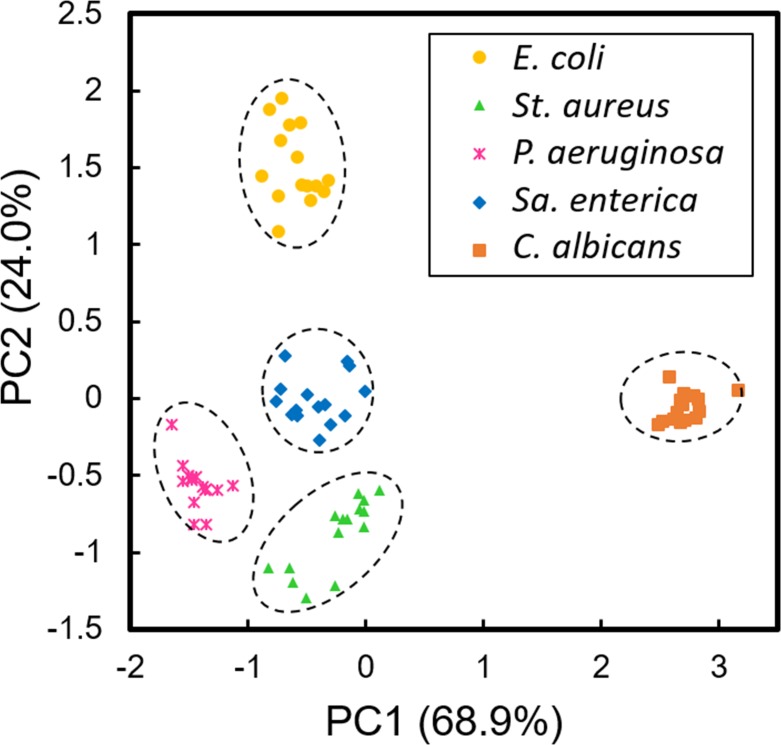
Fig 3. Discrimination results on E. coli, St. aureus, P. aeruginosa, Sa. enterica, and C. albicans based on lensless images.
Principal component analysis (PCA) of maximum specific growth rate (μmax), colony appearance time (ta), and relative intensity (I) extracted from lensless images of 15 microcolonies of 5 microbes. Dashed circles represent the clusters generated by k-means cluster analysis. Data points of 15 colonies of the each microbial species were obtained from two independent culture experiments using different set of the LB-ager chamber and CMOS sensor. Contribution ratios (%) of PC1 and PC2 are shown, respectively.

