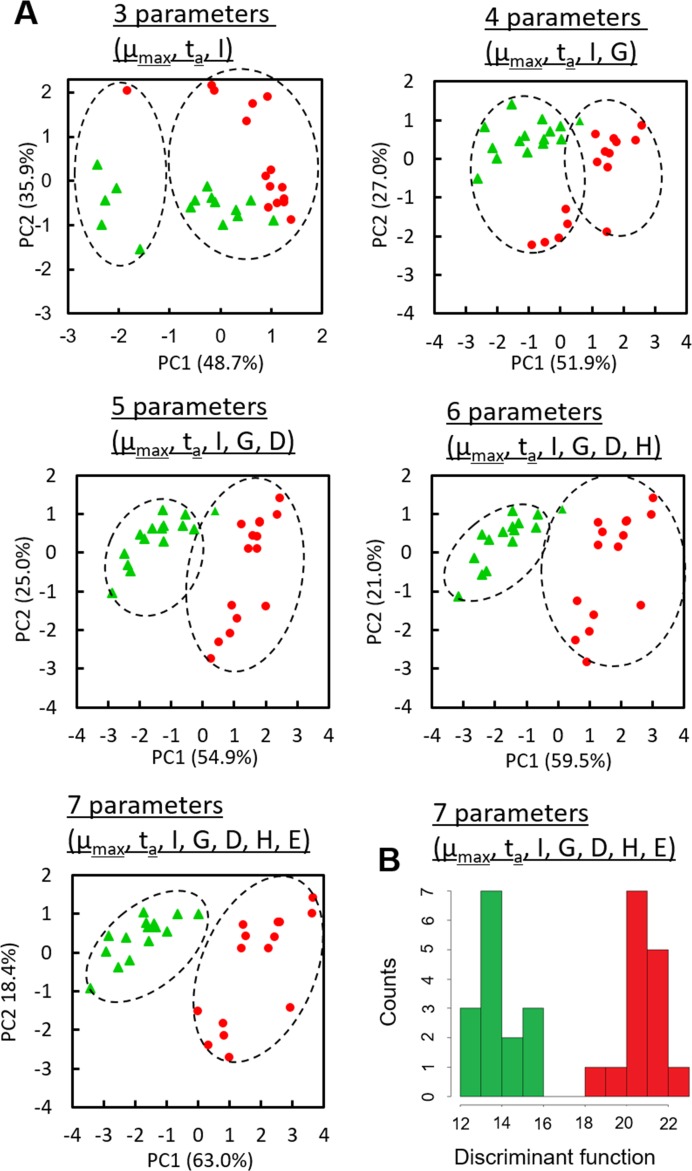
Fig 4. Discrimination results on St. aureus and St. epidermidis based on lensless images.
Data points of 15 colonies of the each microbial species were obtained from two independent culture experiments using different set of the LB-ager chamber and CMOS sensor. Contribution ratios (%) of PC1 and PC2 are shown, respectively. (A) Principal component analysis (PCA) of maximum specific growth rate (μmax), colony appearance time (ta), relative intensity (I), histogram deviation (G), donutness (D), entropy (H), and energy density (E) extracted from lensless images of 15 microcolonies of St. aureus and St. epidermidis. Dashed circles represent the clusters generated with k-means cluster analysis. (B) A histogram of the value of discriminant function (F) based on linear discriminant analysis. All of the F values of St. aureus and St. epidermidis were less than 16 (green columns) and more than 18, respectively (red columns).

