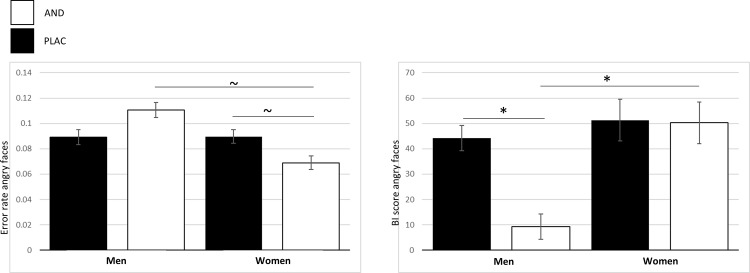
Fig 3. AND- and sex-specific effects for angry faces.
(left) Error rates (possible range 0–1) for angry faces are by trend increased for men compared to women under AND and are by trend reduced within women under AND. (right) Bias indices for angry faces depicting reduced interference under AND exposure in men compared to women and reduced interference within men under AND. Significant results are indicated (~ p < .10; * p < .05) and are based on log-transformed values for reaction times (bias index) and untransformed values for error rates. Errors bars indicate two standard errors of the mean (SEM).

