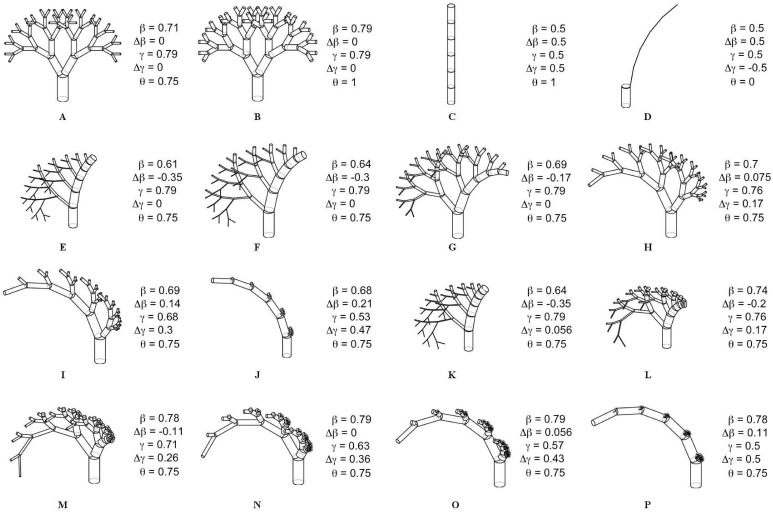
Fig 2. Rendering of Selected Networks.
An assortment of networks are presented with associated average (β, γ) and difference (Δβ, Δγ) scale factors, and metabolic scaling exponents (θ). Note that in all of these cases there is no switching of asymmetry type either within or across generations, and the scale factors are assumed to be constant both within and across branching generations. Networks (A) and (B) represent the symmetric limits under the constraints associated with pulsatile flow (Eqs (16) and (17)) and constant flow (Eqs (20) and (21)), respectively. Networks (C) and (D) represent the two extreme asymmetric limits. Networks (E) through (J) exhibit varying degrees of branching asymmetry while satisfying the constraints associated with pulsatile flow. Each of these tree networks are represented as points that fall along the 3/4 metabolic scaling contour as shown in Fig 4. Networks (I) through (P) satisfy constant laminar flow, and they also fall along the 3/4 metabolic scaling contour as shown in Fig 5.

