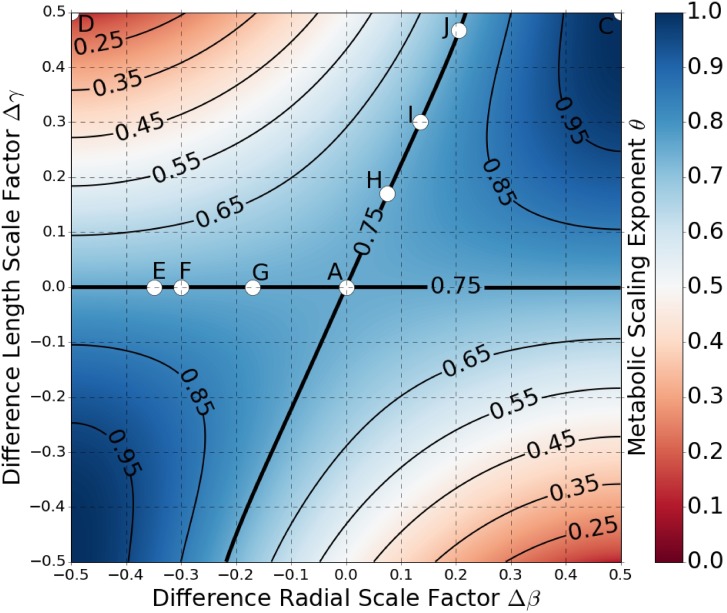
Fig 4. Colormap of Metabolic Scaling Exponent for Pulsatile Flow.
The metabolic scaling exponent is graphed as a function of the difference scale factors Δγ and Δβ, and is shown to range in value from 0 to 1. The scale factors are such that the networks are space-filling fractals that minimize energy-loss from resource transport, as dictated by Eqs (16) and (17). Positive asymmetry is graphed in the first and third quadrants, and negative asymmetry in the second and fourth quadrants. Contours of constant values of the metabolic scaling exponent are plotted in bold. The points labelled A, C, D, and E—J correspond to the rendered trees found in Fig 2.

