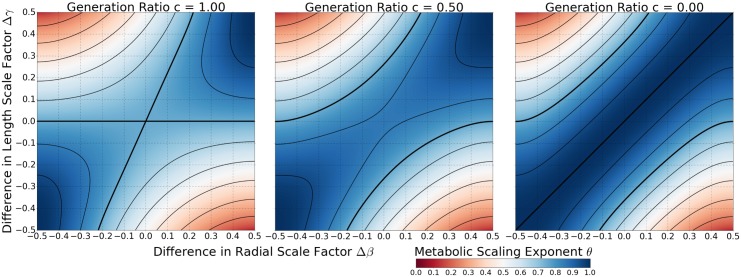
Fig 6. Colormap of Metabolic Scaling Exponent for a Network with a Transition in Flow Type.
Here we present colormaps of Eq (15) for the cases when c = 1, c = 0.5, and c = 0. It should be noted that when the transition in flow type occurs within the networks, the same values for the difference scale factors are used, but the equations that determine the average scale factors switch from Eqs (16) and (17) to Eqs (20) and (21). In all three colormaps, the contour lines take on the same values as in Figs 4 and 5. In particular, the bolded contour corresponds to a metabolic scaling exponent value of 3/4.

