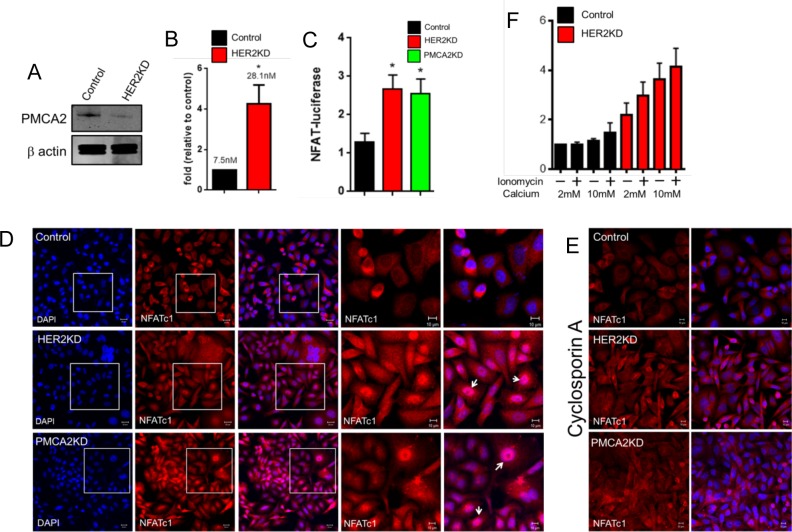
Fig 3. HER2 regulates intracellular calcium concentration in SKBR3 cells.
A) PMCA2 levels in control versus HER2KD-SKBR3 cells as assessed by immunoblot. B) Intracellular calcium measurements in HER2KD-SKBR3 cells relative to control. Numbers indicate the mean calcium concentrations estimated by FURA2 measurements. Each bar represents the mean ± SEM of 3 separate experiments. Asterisk denotes statistically significant difference. C) Expression of a NFAT-luciferase indicator construct in control SKBR3 cells, HER2KD-SKBR3 cells and PMCA2KD-SKBR3 cells. Each bar represents the mean ± SEM of 3 separate experiments. Asterisks denote statistically significant differences. D) Con-focal images of immunofluorescence for NFATc1 (red) or DAPI (blue) in control (top row), HER2KD-SKBR3 (middle row) or PMCA2KD-SKBR3 (bottom row) cells. Scale bars represent 10μm. E) Apoptosis as assessed by TUNEL assay in HER2KD-SKBR3 cells relative to controls exposed to differing concentrations of extracellular calcium ± ionomycin. Each bar represents the mean ± SEM of 3 separate experiments. F) Con-focal images of immunofluorescence for NFATc1 (red) or DAPI (blue) in control (top row), HER2KD-SKBR3 (middle row) or PMCA2KD-SKBR3 (bottom row) cells treated with cyclosporine A to block calcineurin activity. Scale bars represent 10μm.

