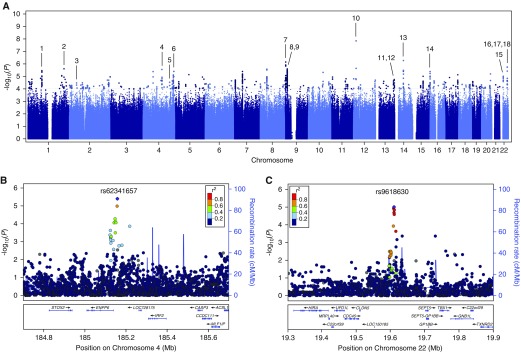
Figure 2.
Manhattan plots generated from genome-wide association study analysis of the acute kidney injury cases and controls. Plots include (A) all markers or single-nucleotide polymorphisms (SNPs) at loci of interest on (B) chromosome 4 and (C) chromosome 22 at higher magnification. Linkage disequilibrium (r2) is indicated relative to the SNP with lowest P value (purple marker) by colored scale. Recombination rates at nearby positions are shown as the background blue lines. Genes located near each locus are displayed in the bottom panels. Loci of interest, corresponding to those in Table E2, are indicated by black lines labeled with the numbers 1 through 18.

