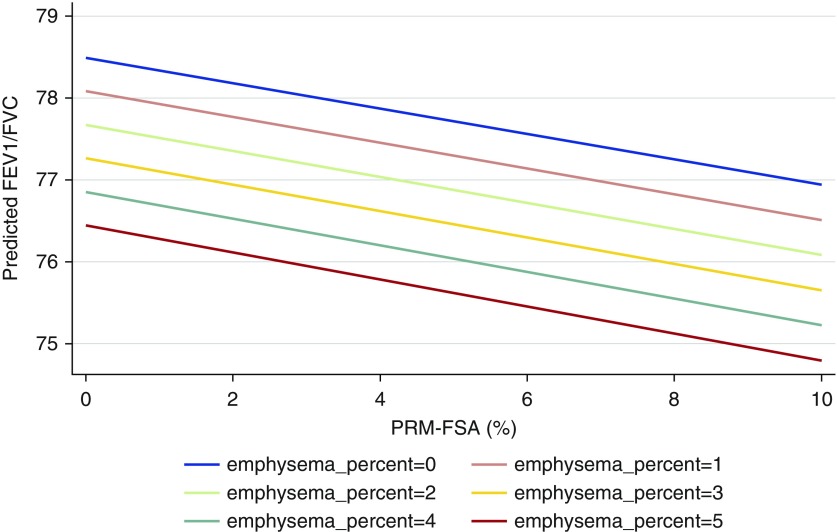
Figure 2.
Changes in FEV1/FVC ratio across varying levels of computed tomography–defined small airway abnormality (parametric response mapping with functional small airways abnormality [PRMFSA]) and emphysema among subjects without airflow obstruction. Increasing percentage of PRMFSA (x-axis) is associated with decreasing FEV1/FVC ratio (y-axis), an effect that persists at any degree of emphysema severity, as shown by the similar slope of the lines describing the burden of emphysema.

