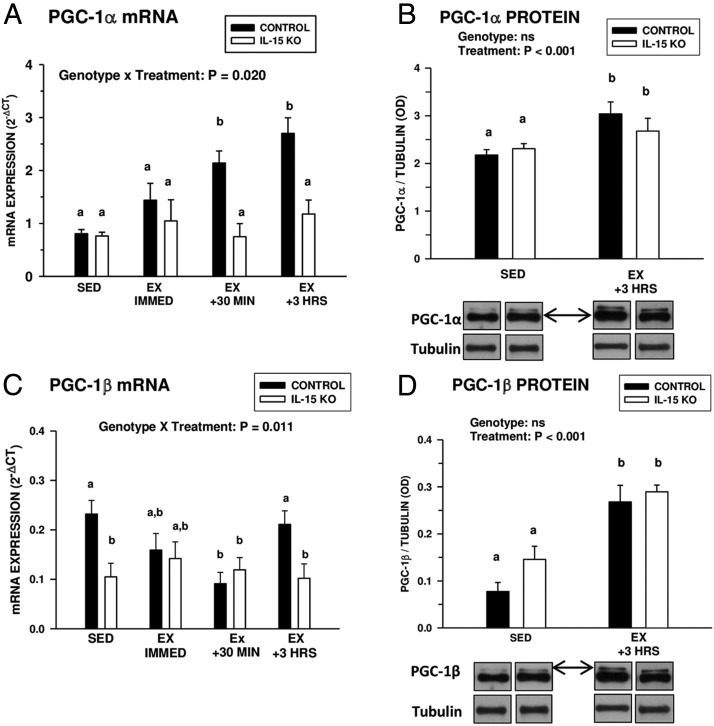
Figure 4.
Postexhaustive exercise induction of PGC-1α and PGC-1β. A and C, PGC-1α (A) and PGC-1β (C) mRNA expression in gastrocnemius muscles of control and IL-15–KO sedentary mice (SED) or at different time points (immediately [IMMED], 30 minutes, and 3 hours [HRS]) after exhaustive exercise (EX). B and D, PGC-1α (B) and PGC-1β (D) protein levels (normalized to tubulin) in the gastrocnemius muscles of SED control and IL-15–KO mice and at 3 hours after exhaustive exercise (EX +3 HRS). Representative Western blots are shown below the respective graphs in B and D; bands shown for each species are compiled from different regions of the same blot. PGC-1α and PGC-1β were detected using a pan-PGC-1 antibody and distinguished by relative mobility, with arrows indicating the species of PGC-1. In each panel, the overall significance of genotype, treatment, or the interaction of these two factors, determined by two-way ANOVA, is shown; bars with different superscripts are significantly different at P < .05. Sample sizes were 6 SED and 9 to 13 EX mice per time point in each genotype. Bars represent means ± SEM.

