
Figure 1.
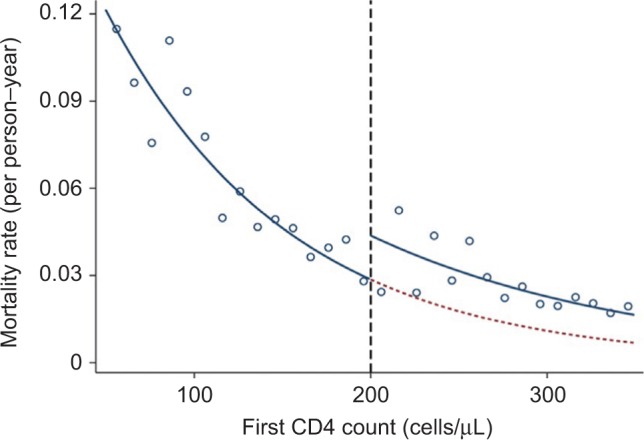
First CD4 count and mortality hazard rate in an HIV-positive population.
Notes: Predicted hazards are displayed as solid lines. Dashed line shows extrapolated prediction if all patients were treatment eligible at first CD4 count. Dots are hazards predicted for CD4 count bins of width 10 cells. Copyright © 2014 by Lippincott Williams & Wilkins. Figure originally published by Bor et al. Regression discontinuity designs in epidemiology: causal inference without randomized trials. Epidemiology 2014;25:729–737.46