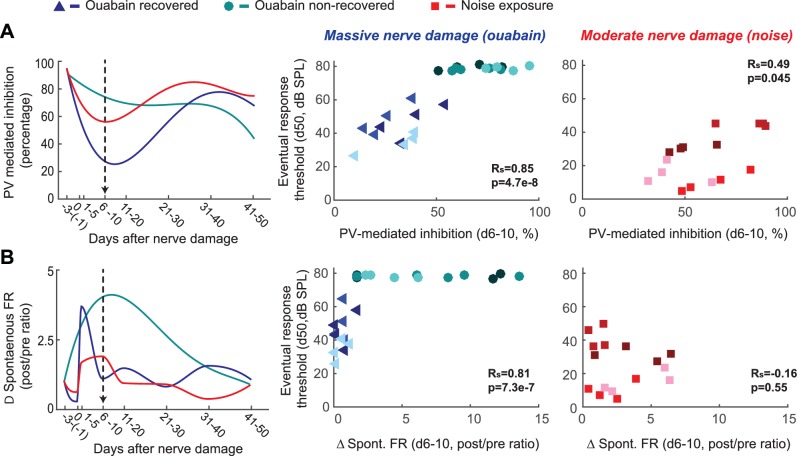
Figure 4. Early changes in PV-mediated inhibitory strength predict eventual recovery of cortical sound processing after nerve damage.
(A–B) PV-mediated inhibition strength (A) and change in spontaneous firing rate (B) timelines for sound exposed, ouabain recovered and ouabain non-recovered mice (red, blue and teal accordingly, plotted for visualization purposes as a fourth order polynomial fit to the data presented Figures 2 and 3). (Middle and Right) Correlation between broadband noise threshold at day 50 and PV-mediated inhibition (A) or spontaneous firing rate change (B) at days 6–10 for ouabain-treated (middle) and sound-exposed mice (right, Spearman’s correlation coefficient, Rs). Each symbol represents a single RS unit. The shape and color correspond to a particular group, as described above. The shading corresponds to a particular mouse within that group.


