. 2017 Mar 16;6:e23687. doi: 10.7554/eLife.23687

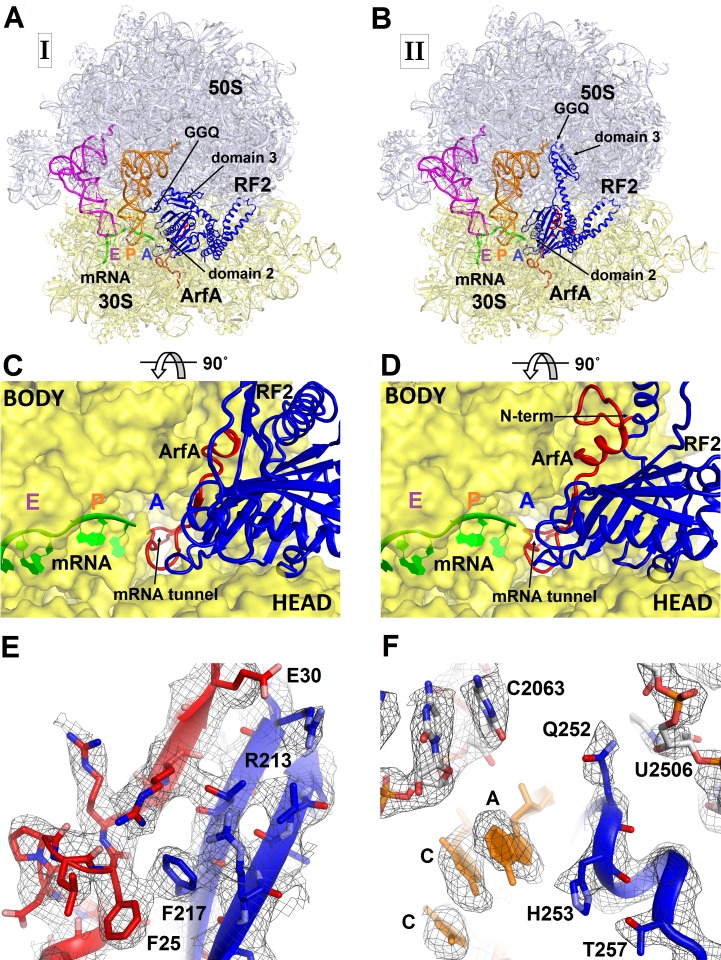
Figure 1. 3.2 Å resolution cryo-EM structures of E. coli 70S ribosome bound with ArfA and release factor RF2.

(A) Structure I with RF2 in a compact conformation; (B) Structure II with RF2 in an extended conformation. Domains 2 and 3 and the GGQ motif of RF2 are labeled. (C) and (D) A close-up view down the mRNA tunnel, showing RF2 and ArfA in the A site of Structure I (C) and Structure II (D). The body and head domains of the 30S subunit are labeled. (E) Extended β-sheet formed by ArfA (red model) and RF2 (blue model). Cryo-EM map (gray mesh) is shown for Structure II at σ = 2.5. (F) Peptidyl-transferase center bound with the 250GGQ252 motif of RF2 in Structure II. Cryo-EM map (gray mesh) is shown at σ = 2.5 for RF2 and at σ = 4.5 for 23S ribosomal RNA and the 74CCA76 end of the P-site tRNA. The maps were sharpened by applying the B-factor of −120 Å2. Additional views of cryo-EM density are available in Figure 1—figure supplements 15. In all panels, the large 50S ribosomal subunit is shown in gray/light-blue; the small 30S subunit in yellow; mRNA in green; E-site tRNA in magenta; P-site tRNA in orange; ArfA in red and RF2 in blue.

DOI: http://dx.doi.org/10.7554/eLife.23687.002

Figure 1.

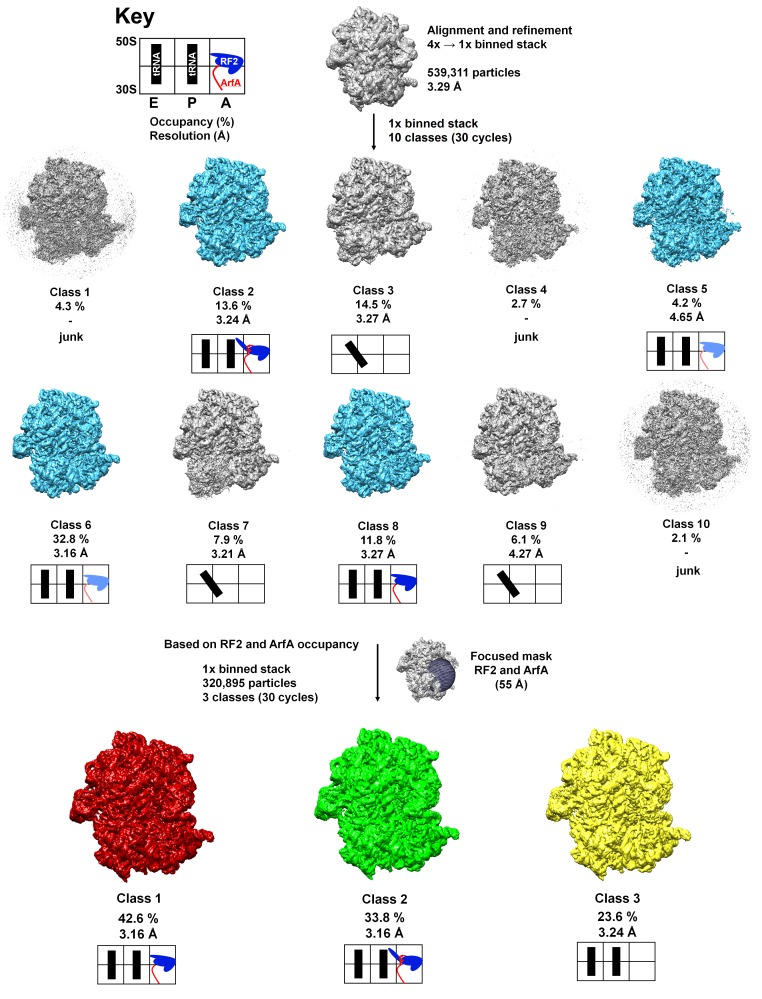
Figure 1—figure supplement 1. Schematic of cryo-EM refinement and classification.

Figure 1—figure supplement 1.

All particles (4x stack) were initially aligned to a single model. 3D classification (10 classes) using the unbinned (1x binned) stack was used to identify the particles containing ArfA and RF2. Subsequent 3D classification using a spherical mask around the A site yielded three ‘purified’ classes representing Structure I, Structure II and the ribosome with a vacant A site. Additional sub-classifications (including up to eight classes) did not yield additional structures (e.g. ArfA-, RF2- or ArfA•RF2-containing classes). Light blue color for RF2 means partial occupancy of RF2. Junk classes are low-resolution classes with poorly resolved structural features that likely originate from misaligned, incomplete or damaged ribosomes.

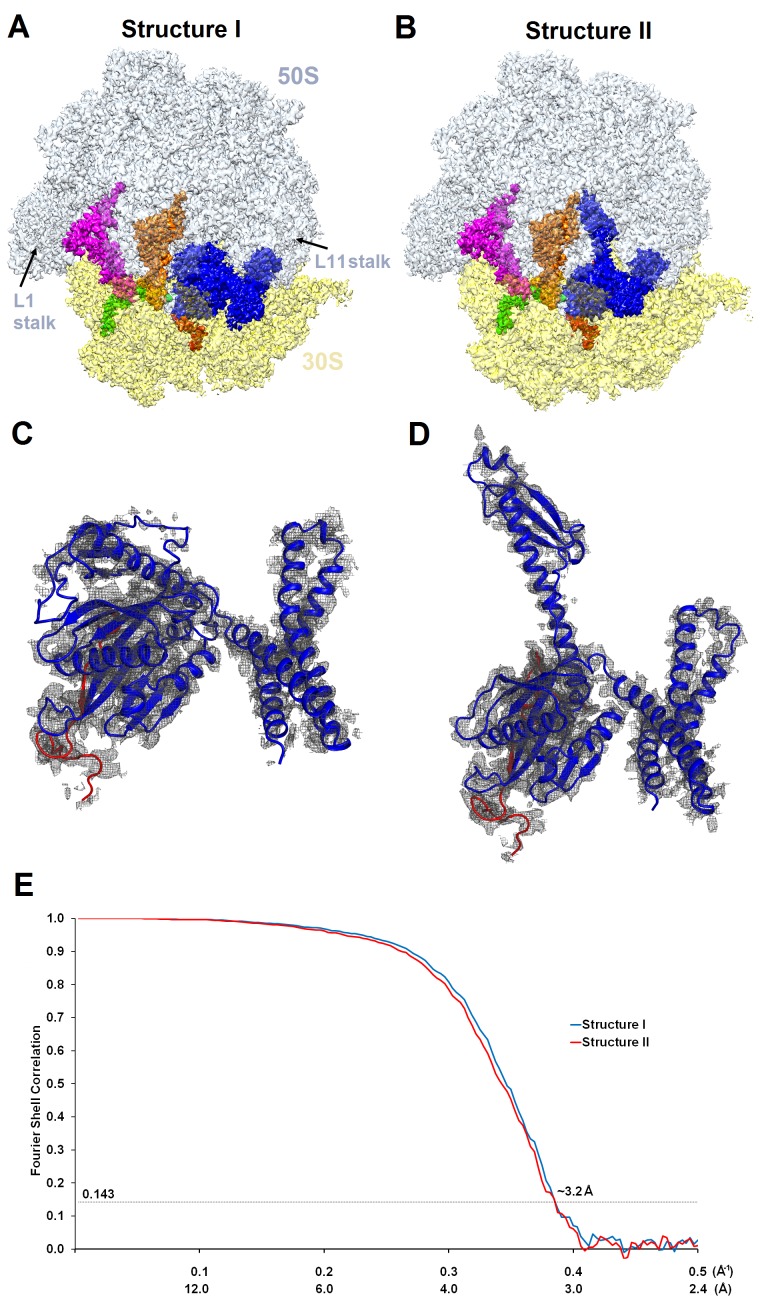
Figure 1—figure supplement 2. Cryo-EM densities of Structures I and II.

Figure 1—figure supplement 2.

(A) and (B) Cryo-EM maps of 70S•ArfA•RF2 complexes were segmented and colored as in Figure 1. (C) and (D) Cryo-EM density (gray) for ArfA (red model) and RF2 (blue model) in Structures I and II. The maps were sharpened by applying the B-factor of −120 Å2. (E) Fourier shell correlation as a function of resolution for Structures I and II.

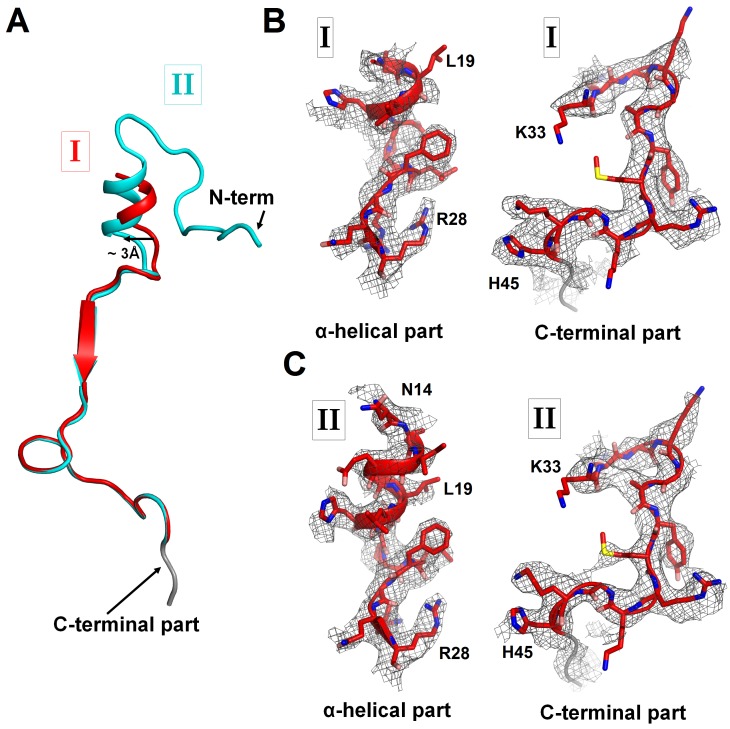
Figure 1—figure supplement 3. Cryo-EM densities corresponding to N- and C-terminal regions of ArfA in Structures I and II.

Figure 1—figure supplement 3.

(A) Superposition of ArfA in Structures I (red) and Structure II (cyan), achieved by structural alignment of the 16S ribosomal RNA. Conformations of the N-terminal region of ArfA relative to the 30S subunit differ between Structures I and II; the difference in the position of the α-helical part is shown with an arrow. (B) Partially resolved α-helical part at the N-terminus and the C-terminal part of ArfA in Structure I (red model) defined by density (gray mesh) at σ = 2.5. (C) Well-resolved α-helical part at the N-terminus and the C-terminal part of ArfA in Structure II (red model) defined by density (gray mesh) at σ = 2.5. The maps were sharpened by applying the B-factor of −120 Å2. A poorly defined region (with the backbone traceable at low σ = 1.0) of the C-terminal structure is colored in gray.

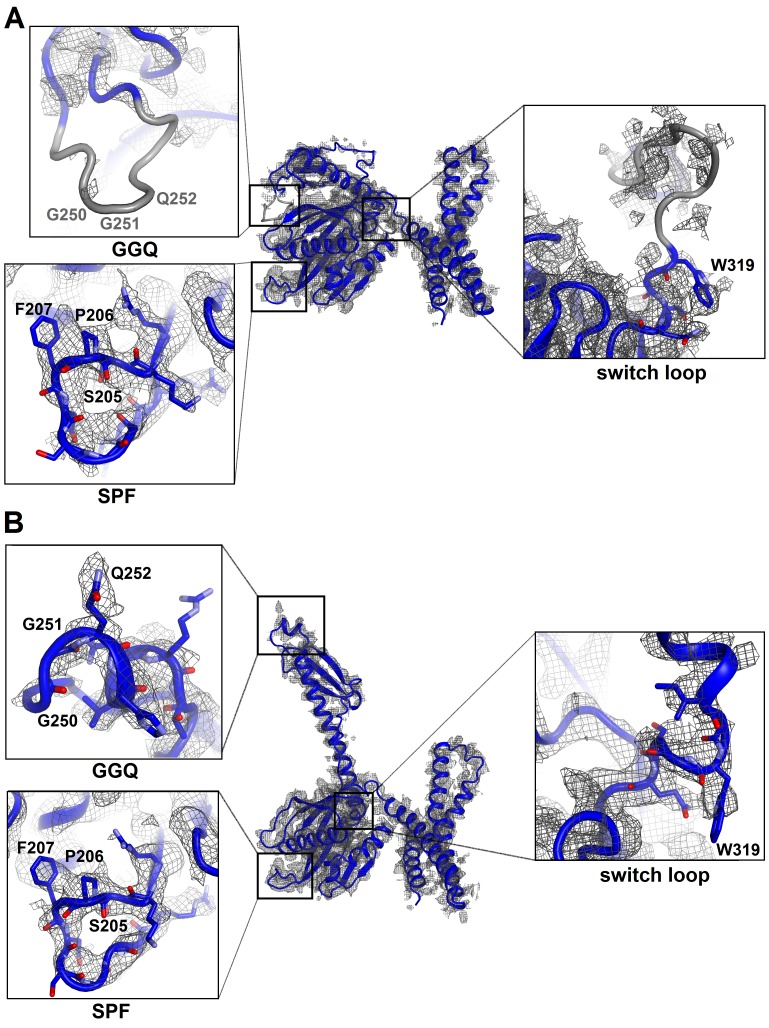
Figure 1—figure supplement 4. Cryo-EM densities corresponding to functional regions of RF2 in Structures I and II.

Figure 1—figure supplement 4.

(A) Compact conformation of RF2 (blue model) defined by density (gray mesh) at σ = 2.5 (except for the map around the switch loop shown at σ = 1.5). Close-up views are shown in boxes for the SPF and GGQ motifs and the switch loop (the orientations differ from that in the main panel). Gray regions are poorly defined in the map, in that the backbone is only traceable at low σ of 1.0 or lower. (B) Extended conformation of RF2 defined by density at σ = 2.5. Close-up views are shown in boxes for the SPF and GGQ motifs and the switch loop. The maps were sharpened by applying the B-factor of −120 Å2. Side chains of most residues are omitted for clarity.

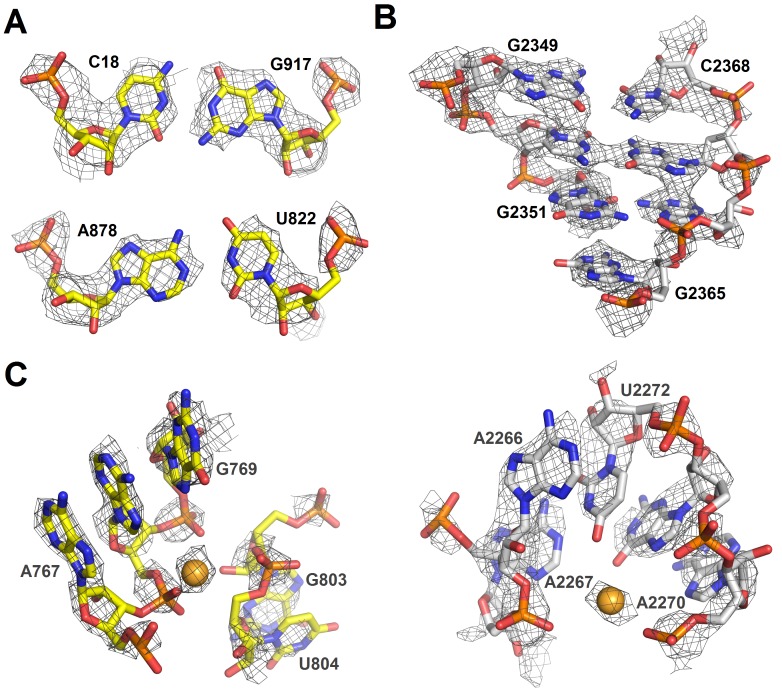
Figure 1—figure supplement 5. Cryo-EM densities of ribosomal RNA in Structure II.

Figure 1—figure supplement 5.

(A) Density (gray mesh) at σ = 4.5 for 16S rRNA nucleotides forming base pairs. (B) Density (gray mesh) at σ = 4.5 for 23S rRNA (part of helix 86) (C) Densities (gray mesh) for a magnesium ion at σ = 4.5 (gold sphere) coordinated by 16S rRNA (yellow) at σ = 6.0 or 23S rRNA (gray) at σ = 6.0. The maps were sharpened by applying the B-factor of −150 Å2.