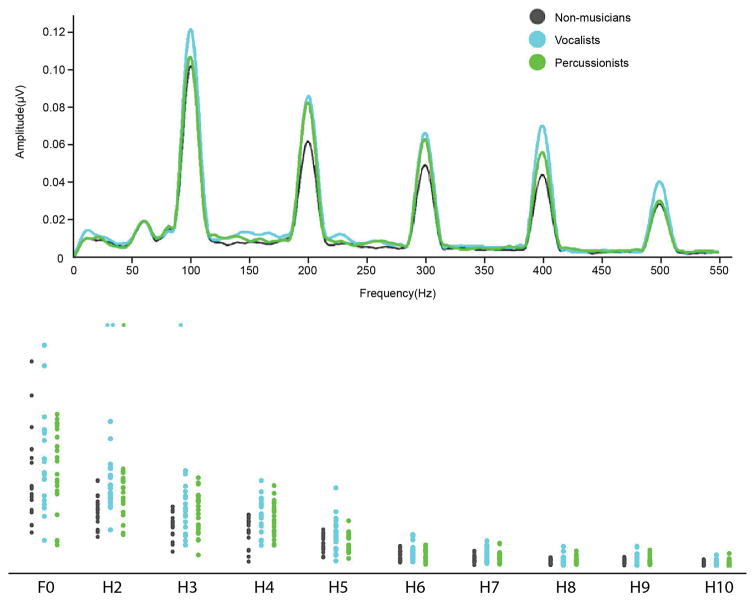
Figure 3.
Scatterplots show the spectral energy in response to the vowel portion of the speech sound/da/presented in quiet, at frequency bins centered at the fundamental frequency (100Hz) and its harmonics. Vocalists have stronger encoding of speech harmonics in quiet at H2, 3 and 4. Percussionists also show stronger encoding of H2 than non-musicians. Inset shows averaged spectral amplitudes by group in the lower harmonics, where group differences were observed.

