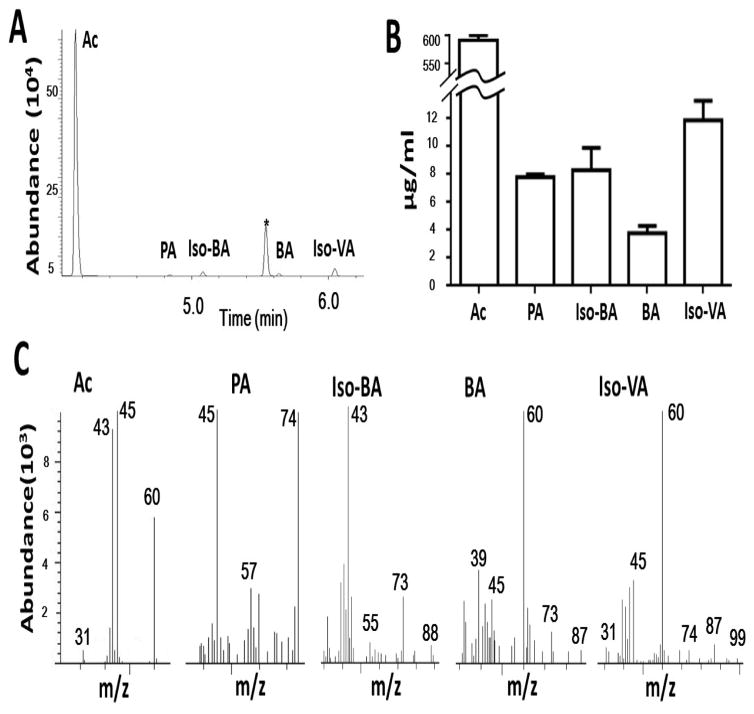
Figure 3.
(A) The ion chromatogram and mass spectrum from GC-MS for identification of SCFAs. Total ion chromatogram for separation of the mixture of SCFAs containing acetic acid (Ac), propionic acid (PA), 2H7-butyric acid (*) (an internal standard), isobutyric acid (Iso-BA), butyric acid (BA) and isovaleric acid (Iso-VA) was displayed by running the GC-MS analysis. (B) The level (μg/ml) of each SCFA was quantified. (C) The mass spectra for AC, PA, Iso-BA, BA, and Iso-VA with their corresponding molecular ions (m/z) were shown.

