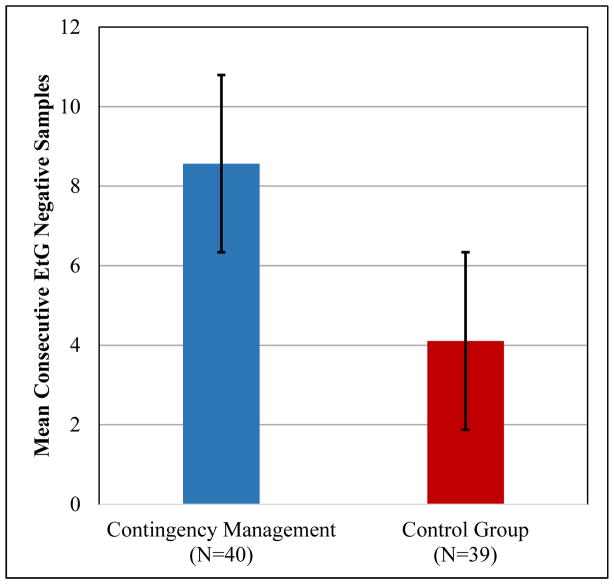
FIGURE 2.
Group differences in longest duration of continuous alcohol abstinence.
Note: The Figure represents the mean number of continuous alcohol-negative ethyl glucuronide alcohol tests attained by the contingency management and non-contingent control groups during the intervention period, F (3)=5.55, df=1, 76, p<0.05.

