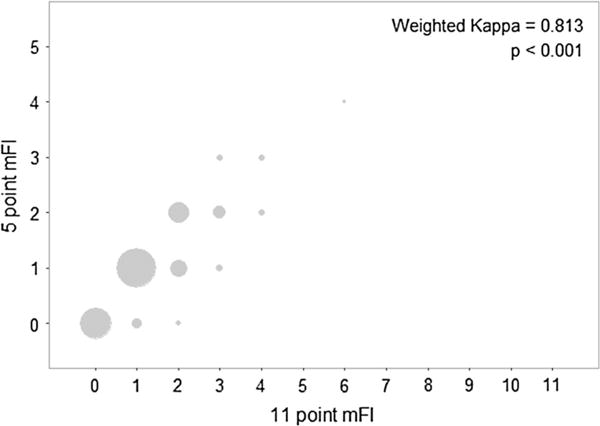
Fig. 1.

The scatterplot shows the 11-point mFI (x-axis) and 5-point mFI (y-axis) scores for 885 patients with complete data. The size of the points is proportional to the number of patients. The weighted Kappa statistic and p value are provided. For reference, a weighted Kappa of 1 would correspond to perfect agreement and 0 to no agreement between the two measures
