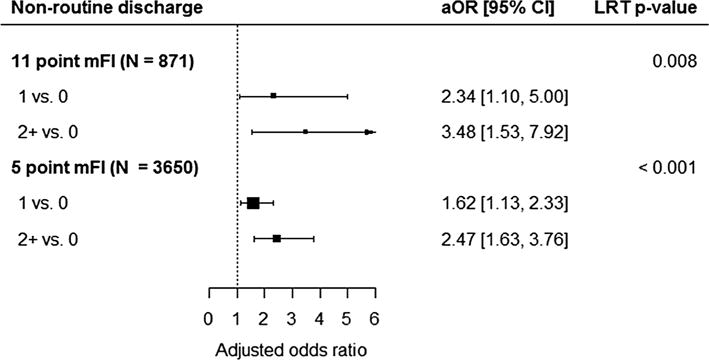
Fig. 4.

The forest plot shows the adjusted odds ratios and 95% confidence intervals comparing mFI levels in the 11-point index multiple regression analysis (above) and the 5-point index multiple regression analysis (below). An adjusted odds ratio greater than 1 indicates an increased odds of non-routine discharge (among patients discharged alive). An overall p value for the association of mFI with the outcome was calculated using a likelihood ratio test (LRT) with 2 degrees of freedom
