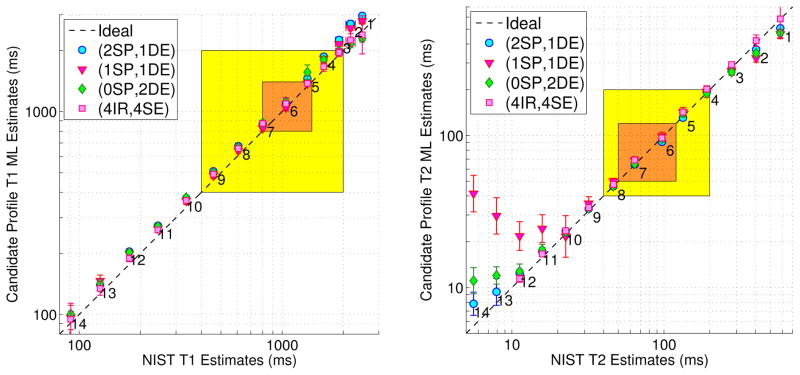
Fig. 1.
Phantom within-ROI sample statistics of T1 and T2 ML estimates from optimized SPGR/DESS and reference IR/SE scan profiles, vs. NIST NMR measurements [68]. Markers and error bars indicate ROI sample means and ROI sample standard deviations within the 14 labeled and color-coded vials in Fig. S.7. Tight 𝒳t and broad 𝒳b latent parameter ranges are highlighted in orange and yellow, respectively. Fig. S.8 provides analogous plots for RLS estimates. Table S.2 replicates sample statistics within Vials 5–8. Our MR measurements are at 293K, while NIST NMR measurements are at 293.00K. Within the designed parameter ranges, estimates from different acquisitions are in reasonable agreement with NIST measurements.

