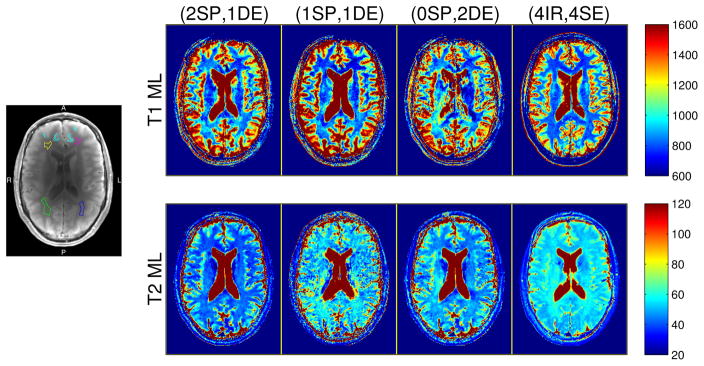
Fig. 2.
Left: WM and GM ROIs, overlaid on a representative anatomical (coil-combined IR) image. Separate WM ROIs are distinguished with anterior/posterior (A/P) and right/left (R/L) directions. Four small anterior cortical GM polygons are pooled into a single ROI (cyan). Right: Colorized T1 and T2 ML estimates from the brain of a healthy volunteer. Columns correspond to profiles consisting of (2 SPGR, 1 DESS), (1 SPGR, 1 DESS), (0 SPGR, 2 DESS), and (4 IR, 4 SE) acquisitions. Parameter maps are cropped in post-processing for the purpose of display. Figs. S.9 (colorized) and S.10 (grayscale) provide analogous full-FOV maps estimated via both ML and RLS estimators. Colorbar ranges are in milliseconds.

