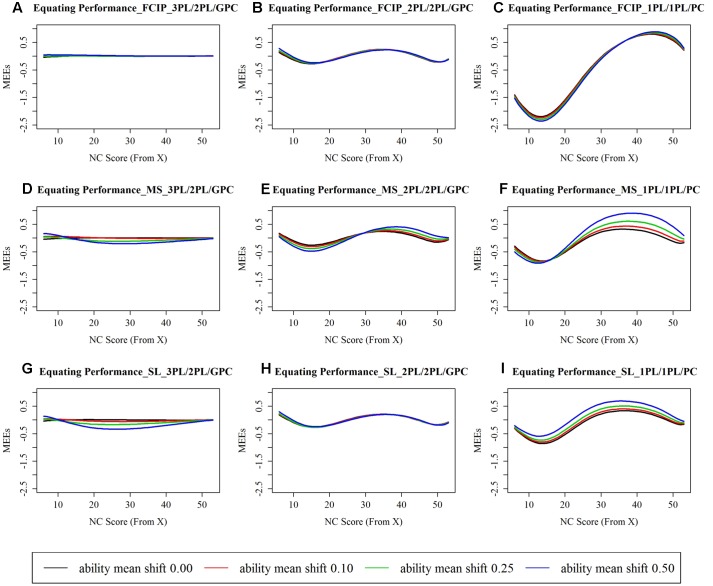
FIGURE 1.
Mean errors of equating (MEE) between estimated and true score conversions. (A) Equating performance under the 3PL/2PL/GPC × FCIP condition; (B) Equating performance under the 2PL/2PL/GPC × FCIP condition; (C) Equating performance under the 1PL/1PL/PC × FCIP condition; (D) Equating performance under the 3PL/2PL/GPC × MS condition; (E) Equating performance under the 2PL/2PL/GPC × MS condition; (F) Equating performance under the 1PL/1PL/PC × MS condition; (G) Equating performance under the 3PL/2PL/GPC × SL condition; (H) Equating performance under the 2PL/2PL/GPC × SL condition; (I) Equating performance under the 1PL/1PL/PC × SL condition. FCIP, separate calibration with linking and fixed common item parameter; MS, mean/sigma method; SL, Stocking and Lord characteristic curve method; 3PL, three-parameter logistic model; 2PL, two-parameter logistic model; 1PL, one-parameter logistic model; GPC, generalized partial credit model; PC, partial credit model. x-axis, number of correct (NC) score point ranging from 6 to 53. The examinees being scored out of this range were those who answered all items correct or answered quite fewer items correct than simply guessing based on the generating model. y-axis, mean errors of equating (MEEs) between the estimated and the true conversion tables conditioning at each NC score point.

