
Figure 4.
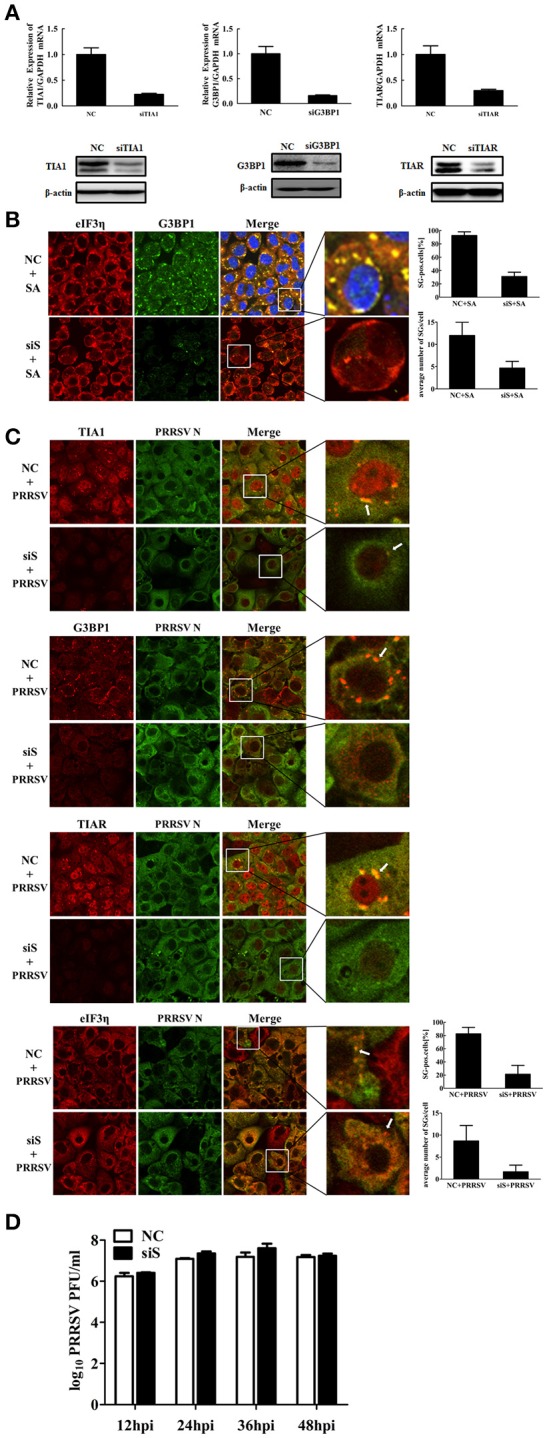
Effects of SGs disassembly on PRRSV growth. (A) The silencing efficiency of TIA1-, G3BP1-, or TIAR- specific siRNAs. MARC-145 cells were transfected with 50 nM/well siTIA1, siG3BP1, siTIAR or negative control (NC) siRNA for 36 h each. The expression levels of TIA1 (left), G3BP1 (middle), or TIAR (right) were determined by RT-qPCR (top) and Western blotting (bottom). (B) MARC-145 cells were transfected with NC siRNA or siS, the siRNA pools of TIA1, TIAR, and G3BP1, then treated with 0.5 mM SA for 1 h, stained with antibodies against G3BP1 or eIF3η, followed by staining with Alexa 594-conjugated donkey anti-goat IgG for eIF3η, Alexa 488-conjugated donkey anti-rabbit IgG for G3BP1. Nuclei were stained with DAPI (blue). Stained cells were examined by confocal microscope. The percentage of SG-positive cells (up) and average number of SGs per cell (down) were quantified. Error bars show standard deviations. (C) MARC-145 cells were simultaneously transfected with siTIA1, siG3BP1 and siTIAR for 24 h, and then infected with PRRSV. At 36 hpi, the cells were fixed, stained with antibodies against PRRSV N, TIA1, G3BP1, TIAR, or eIF3η, followed by staining with Alexa 594-conjugated donkey anti-goat IgG for TIA1, TIAR, or eIF3η, Alexa 594-conjugated donkey anti-rabbit IgG for G3BP1, Alexa 488-conjugated donkey anti-mouse IgG for PRRSV N. Nuclei were stained with DAPI (blue). The stained cells were examined by confocal microscope. The percentage of SG-positive PRRSV-infected cells (up) and average number of SGs per cell (down) were quantified. Error bars show standard deviations. The arrows point the SGs in cytoplasm. (D) MARC-145 cells are treated as described in (C). Then the cells and their supernatants were collected together at the indicated times post-infection to determine their viral titers by plaque assay.