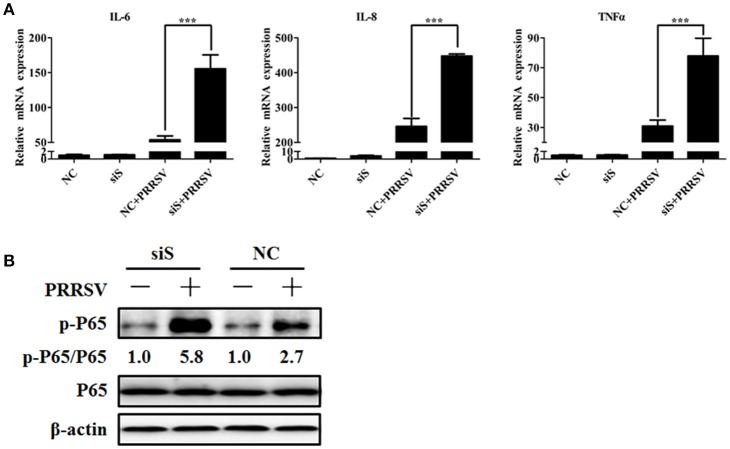
Figure 5.
Role of SGs in the PRRSV-induced inflammatory responses. (A) MARC-145 cells were simultaneously transfected with siTIA1, siG3BP1, and siTIAR for 24 h, and cells were then mock-infected or infected with PRRSV. Cytokine mRNA levels (IL-6, IL-8, and TNF-α) were evaluated using real-time RT-qPCR assays at 36 hpi. ***P < 0.01, comparison between cells transfected with NC siRNA and specific siRNA followed by PRRSV infection. (B) MARC-145 cells are treated as described for (A). At 36 hpi, the levels of p65 phosphorylation were evaluated by Western blotting. The ratio of phosphorylated/total p65 was analyzed using ImageJ Software.

