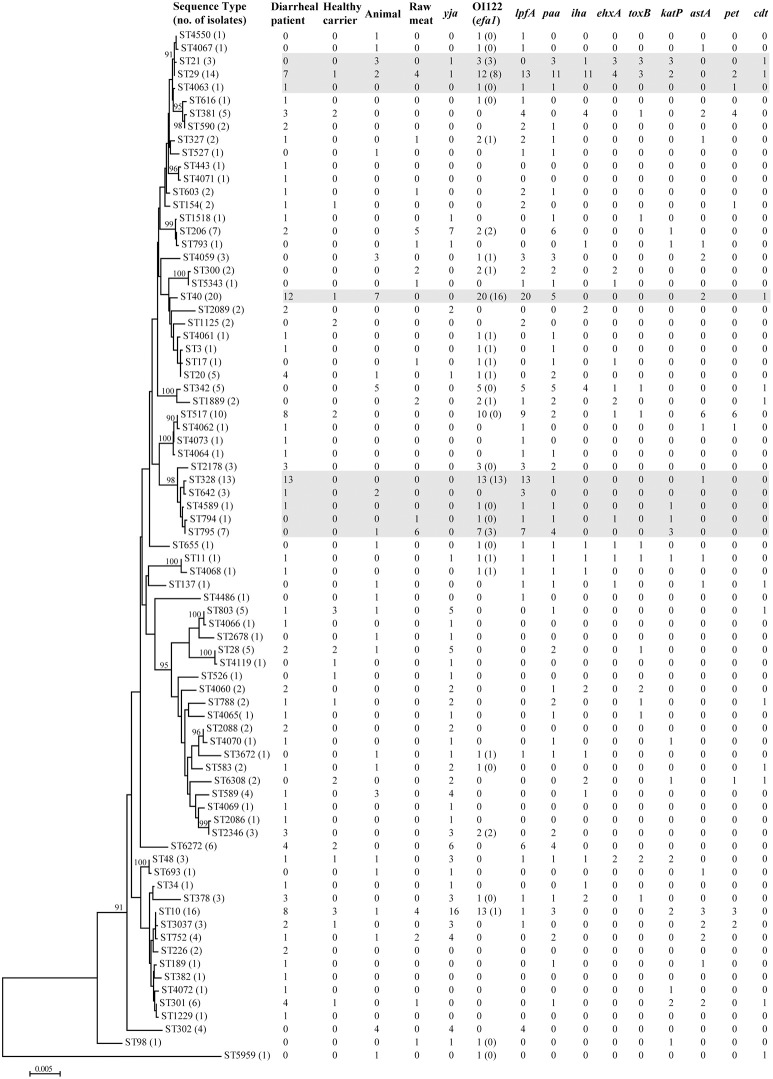
Figure 1.
Phylogenetic relationships and virulence profiles of the 79 STs among the 228 aEPEC isolates. An unrooted phylogenetic tree was constructed by the neighbor-joining algorithm based on the Maximum Composite Likelihood model of nucleotide substitution. Bootstrap values greater than 90% based on 1000 replications are given at the internal nodes. STs highlighted in gray were the most prominent STs containing aEPEC isolates and harbored genes located on OI-122 (nleB, nleE, set/ent, or efa1 (lifA)) and lpfA.

