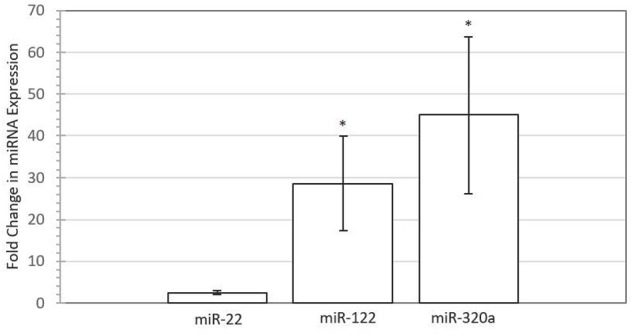
FIGURE 3.

Increased expression of miRNAs in Bovine Endometrial Epithelial Cells following supplementation with 50 nM miRNA mimic for miR-22 (P > 0.05), miR-122 (P < 0.05), and miR-320a (P < 0.05) compared with untreated control for four biological replicates. Error bars represent the SE for the mean fold change of the expression range. Asterisk denotes significant difference between treated and control cells.
