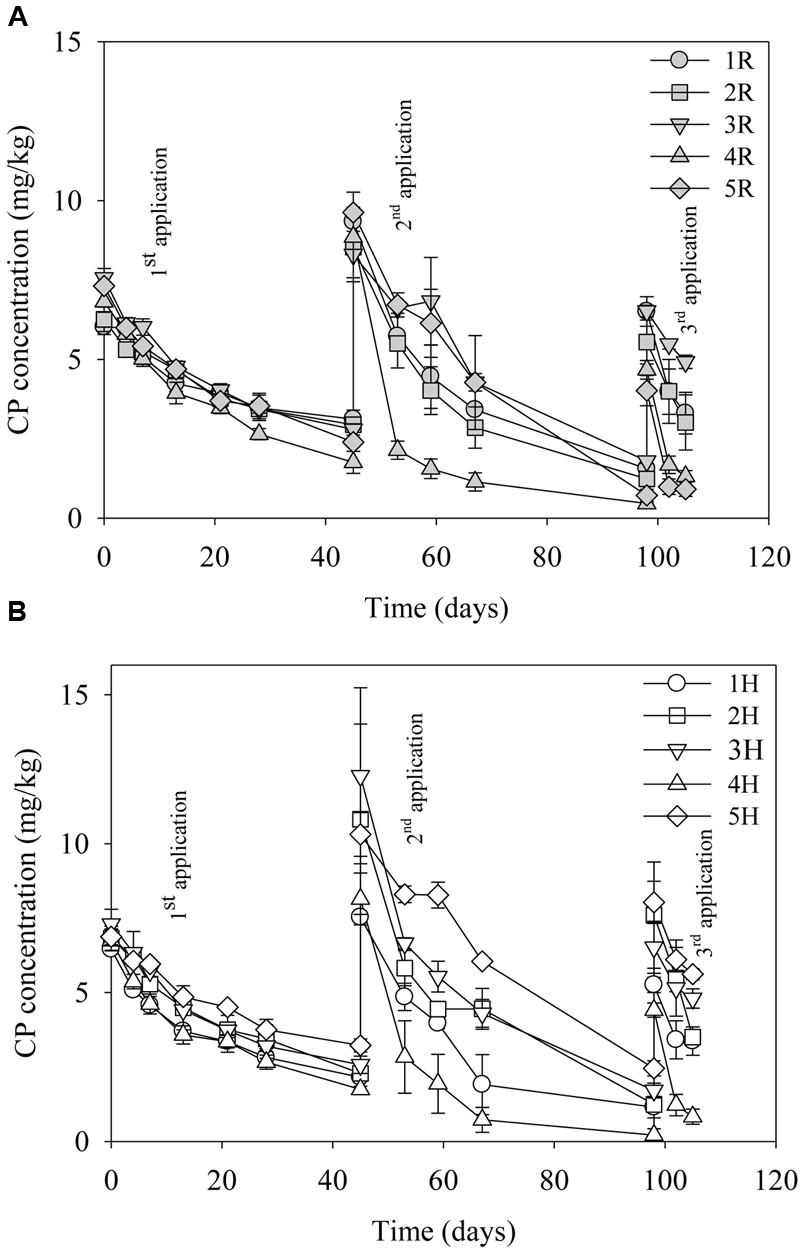
FIGURE 1.

Degradation of chlorpyrifos (CP) in the different sites (soils) after three repeated laboratory applications (10 mg/kg). (A) Sites treated with pesticides in the fields (R) and (B) headland sites not treated with pesticides (H). Error bars represent standard error of the mean (n = 3). No errors bars are of the same size or smaller than the plot symbols.
