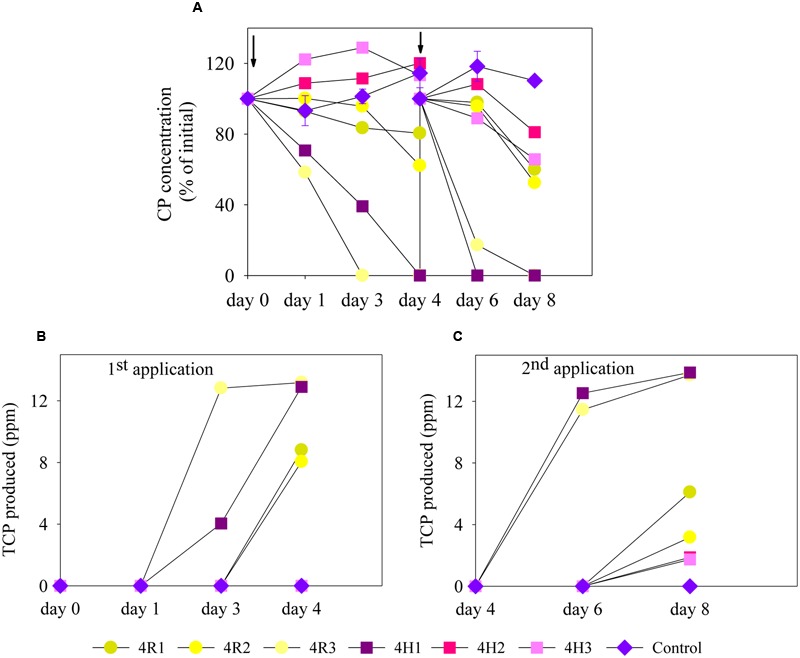
FIGURE 2.

Degradation of CP and production of TCP following two successive applications of CP in mineral salt medium (MSM) inoculated with bacterial communities (4R and 4H) and control samples; (A) CP degradation, (B) TCP production after the first CP application (enrichment), and (C) TCP production after the second CP application (enrichment). For visualization purposes, all the replicates of 4R and 4H were plotted individually here. Error bars on control (un-inoculated treatment) represents standard error of the mean (n = 3). No visible error bar means that bars are of the same size or smaller than the plot symbols. The arrows on the graph (A) represents the day when re-spiking was done. TCP, 3,5,6-trichloro-2-pyridinol.
