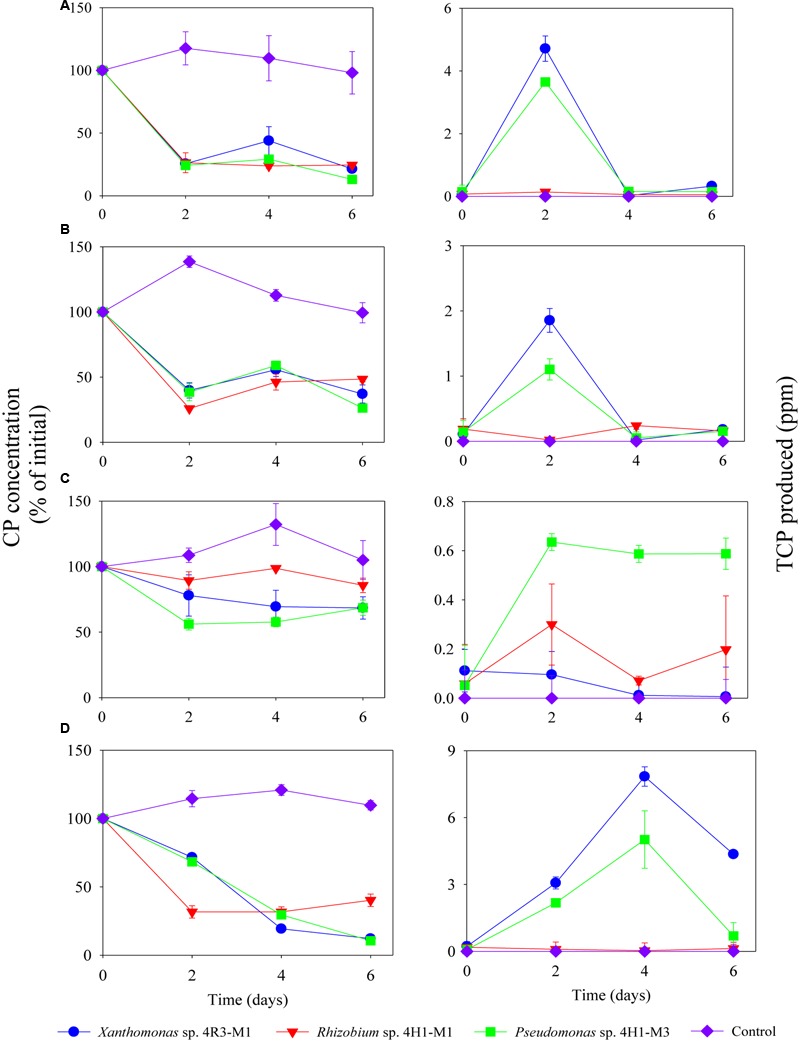
FIGURE 4.

Degradation of CP (%) and production of TCP (ppm) by Xanthomonas sp. 4R3-M1, Rhizobium sp. 4H1-M1 and Pseudomonas sp. 4H1-M3 in different media: (A) MSM (+N+ P - C), (B) MSM (-N + P + C), (C) MSM (+N - P + C) and (D) SEM. Error bars represent standard error of the mean (n = 3). No visible error bar means that bars are of the same size or smaller than the plot symbols.
