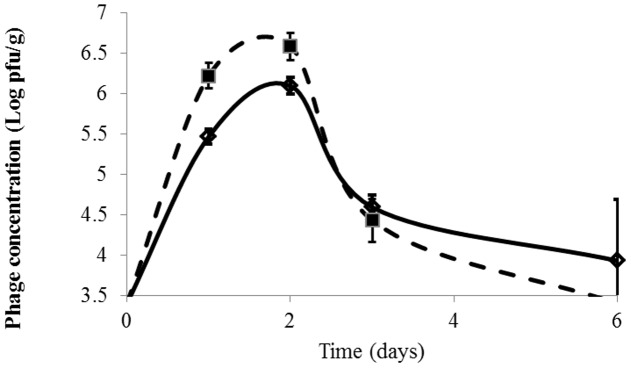
FIGURE 3.
Evolution of phage concentration (Log pfu/ml) in fish tissue during fish spoilage at 6°C. Fish 1 and Fish 2. Detection limit = 3.5 Log pfu/g. Phage concentatrion in not inoculated samples were always below 3.5 Log pfu/g. Initial value (time = 0) is <3.5 Log pfu/g. Visible initial point is 0.4 h after phage application.

