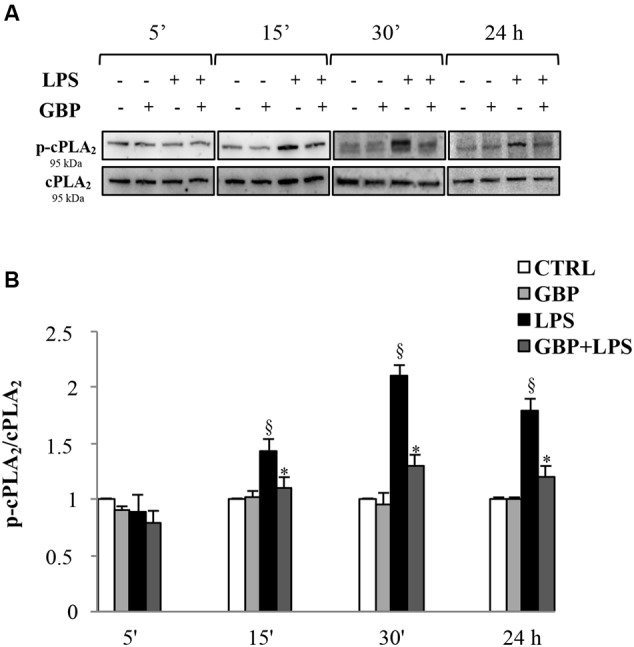
FIGURE 3.

Effects of gabapentin on cPLA2 activation by LPS in corneal cells. SIRC were pre-incubated in SFM for 1 h with gabapentin (10 μg/ml) and the inflammatory stimulus was induced with LPS (1 μg/ml) for the different time points reported in figure. Lysated were prepared for Western blot analysis, as described in section “Materials and Methods.” (A) Representative immunoblot images of phospho-cPLA2 (p-cPLA2) and total-cPLA2 after LPS treatment with or without gabapentin. (B) Phospho-cPLA2/cPLA2 band intensity ratios of protein levels. Values represent mean ± SD, ∗p < 0.05 vs. LPS, xp < 0.01 vs. CTRL. One-way ANOVA, followed by Tukey’s test.
