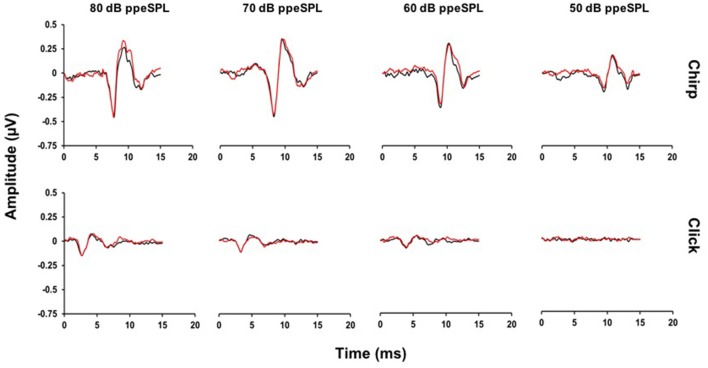
Figure 3.
Average CAP waveforms evoked by chirps (top) and clicks (bottom) for a representative subject. Small reductions in N1 peak amplitudes with CAS can be seen in the chirp-evoked CAP waveforms at lower stimulus levels, but not for the click at any level. Note that at 50 dB ppeSPL, a click-evoked CAP was not identified in this subject (Black = without CAS; Red = with CAS).

