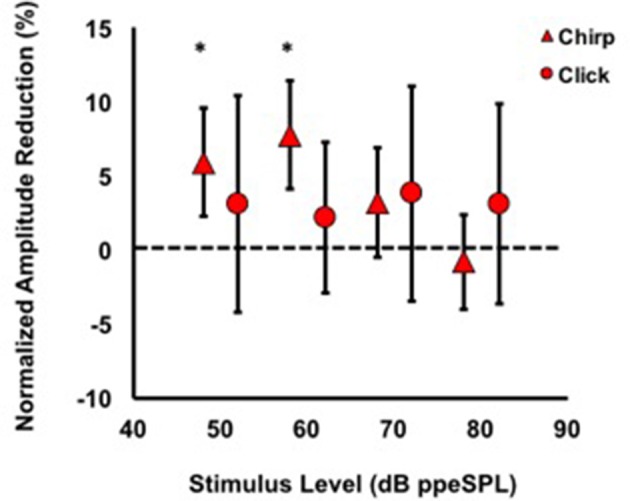
Figure 5.

Average normalized chirp and click amplitude reductions for all subjects. Asterisks indicate significant reductions (p <0.01). Note that at every stimulus level, chirp inhibition was less variable than clicks, as indicated by the 95% confidence interval bars.
