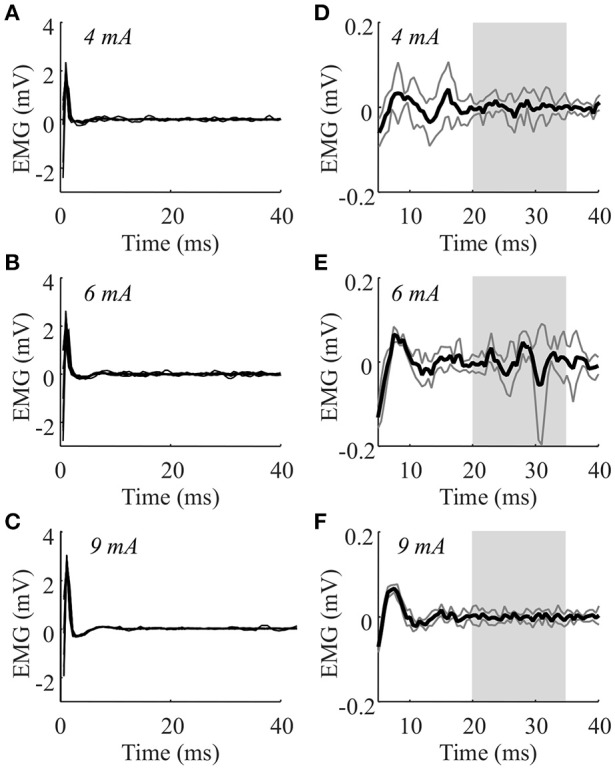
Figure 2.

The H-reflexes obtained from one patient (ET) using surface stimulation on the wrist extensor muscle. The EMG during stimulation at 3, 4, 5, 6, 9, 12, and 15 rnA were recorded in this muscle of this patient. Panels (A–C) show the eight individual traces superimposed for 4, 6, and 9 rnA. Panels (D–F) show the averaged responses from the same stimulation intensities zoomed in to show the responses (dark gray lines indicate standard deviations). The H-reflex amplitude was identified as the peak-to-peak amplitude of the average response in the range 20–35 ms (light gray area).
