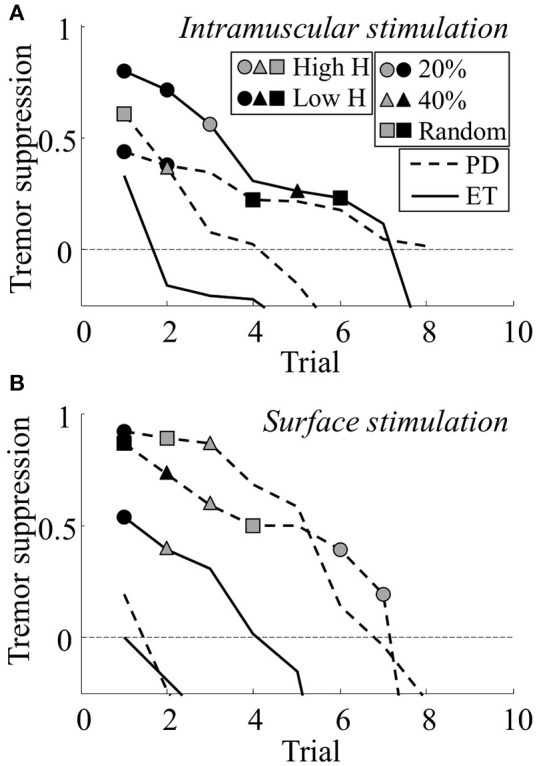
Figure 4.

The level of tremor suppression obtained across the different trials for all patients using intramuscular (A) and surface (B) stimulation. The y-axis is truncated below –0.25. Several trials showed negative levels of tremor suppression below this point and are not shown in the plot. In both panels, each line indicates all trials from one patient (dashed line, Parkinson's Disease; unbroken line, Essential Tremor). The trials are ranked according to obtained suppression level (best trial first). Trials with statistical significant suppression are indicated with a symbol: Circles represent short stimulation duration (20% of tremor cycle), triangles represent long stimulation duration (40% of tremor cycle), and squares represents random stimulation timing. Symbol color indicates stimulation intensity: Gray represents stimulation at currents evoking high H-reflexes and black represents stimulation at currents evoking low H-reflexes.
