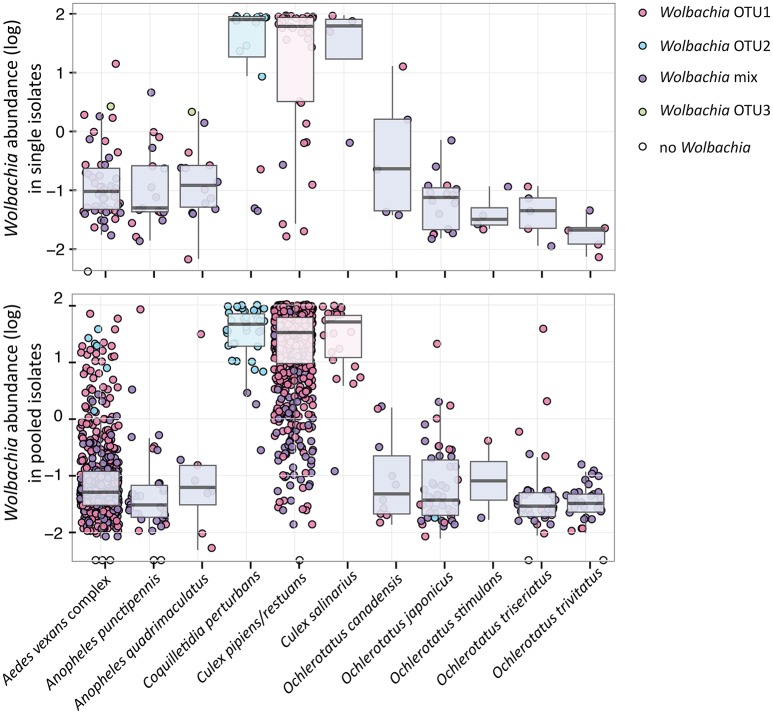
Figure 4.
Wolbachia relative abundance and presence of dominating OTUs for 11 analyzed species sampled as individuals and pools. The relative abundance represents 16S rRNA read percentage assigned to any Wolbachia OTU. The color key for individual points (samples) and box plots reflects the presence of particular OTU(s), i.e., 100% of reads assigned to the single Wolbachia OTU in red, blue and green; mixed infection in purple.

